Fig. 2.
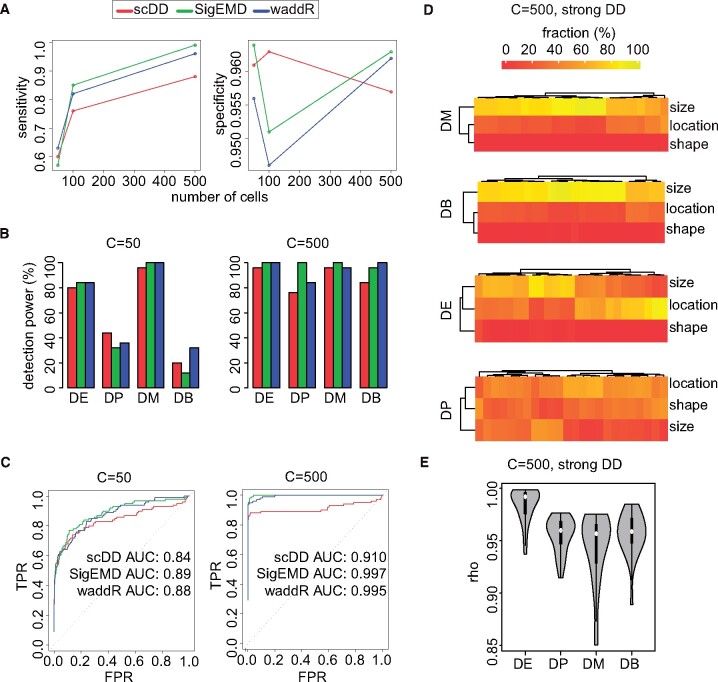
(A–C) Performance metrics when simulating a weak degree of DD and with P-value threshold of 0.05: (A) Sensitivity and specificity depending on the number of cells. (B) Detection powers for the different DD categories according to Korthauer et al. (2016), depending on number of cells C. (C) ROC curves with AUC values, depending on number of cells C. (D) Decomposition of the 2-Wasserstein distance for C = 500 and a strong degree of DD for the different DD categories, shown for those genes that have been detected as DD. Note that there is no exact one-to-one correspondence and interpretation between the scDD categories and the terms of the decomposition of the 2-Wasserstein distance. (E) Violin plots of the correlation coefficient ρ in the decomposition of the 2-Wasserstein distance for C = 500 and a strong degree of DD for the different DD categories, based on those genes that have been detected as DD

