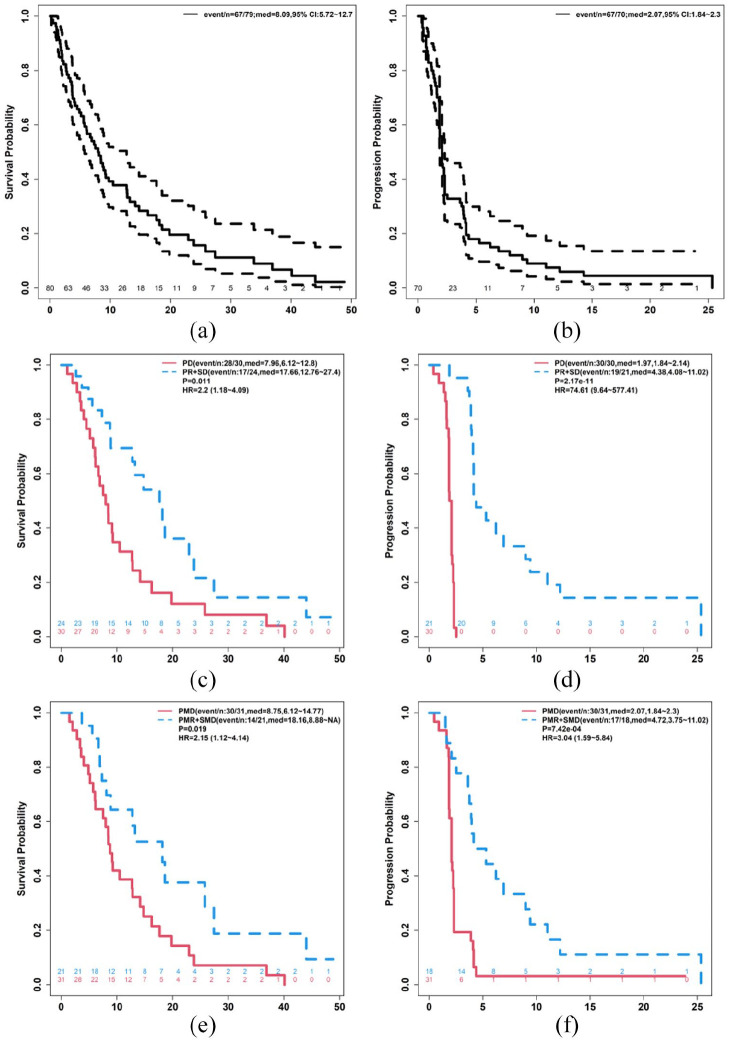
Figure 2.
Response data. Demonstrates overall survival (a), time to progression (b), times to progression by best anatomic (c) or best metabolic (d) response, as well as overall survival by best anatomic response (e), and best metabolic response (f).
PD: progressive disease; PMD: partial metabolic response; PMR: partial metabolic response; PR: partial response; SD: stable disease; SMD: stable metabolic response.

