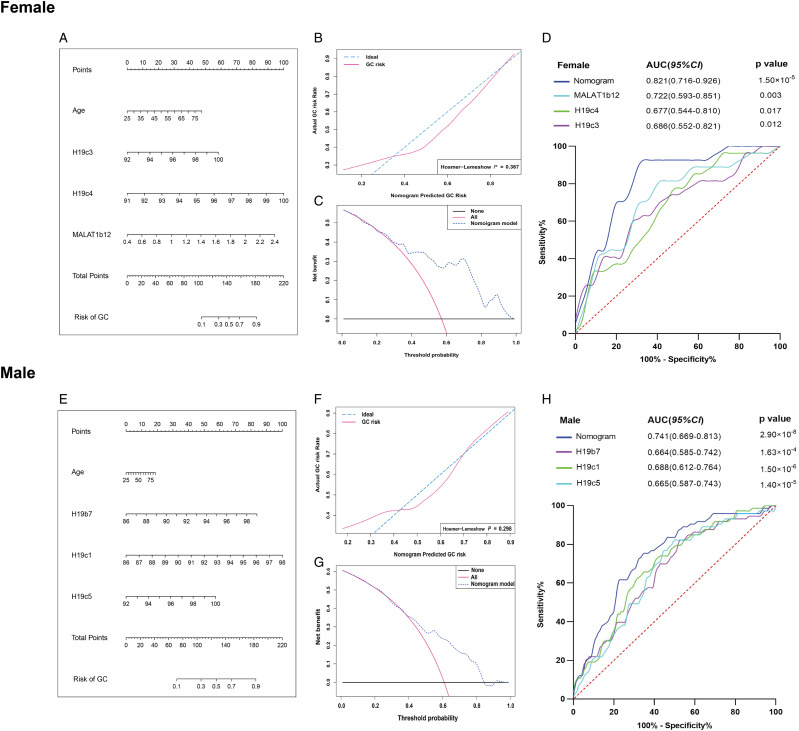
Figure 4.
The logistic regression-based nomogram model for predicting the risk of GC in the female and male groups. The methylation levels of H19c3, H19c4, MALAT1b12, and age were used to construct the nomogram for predicting the risk of GC in female group (A-D), while the methylation levels of H19b7, H19c1, and H19c5 were used to construct the nomogram for predicting the risk of GC in male group (E-H). (A, D) The construction of the nomogram. The value of each variable was given a score on the point scale axis. A total score could be calculated by adding each single score, and by projecting the total score to the lower total point scale, we were able to estimate the probability of GC in female and male groups. (B, E) The calibration curve and the Hosmer–Lemeshow (H-L) test of the nomogram. The calibration curve with 1000 bootstrap resampling was made for an assessment of the nomogram-predicted probabilities of GC in female and male groups. The H-L test was used to examine how well the percentage of the actual probability of the GC matched the percentage of the nomogram-predicted probability of GC over deciles of predicted risk in the female and male groups. (C, F) Decision curve analysis of the nomogram. The decision curve analysis was performed to compare the standardized net benefit of the nomogram at the different threshold probabilities. The ranges of the standardized net benefit of the nomogram were very wide and practical. (D, H) Receiver operating characteristic curve. The area under receiver (AUC) operating characteristic curve values for the constructed nomogram of GC in female and male groups was .821 and .741, respectively. GC: gastric cancer.

