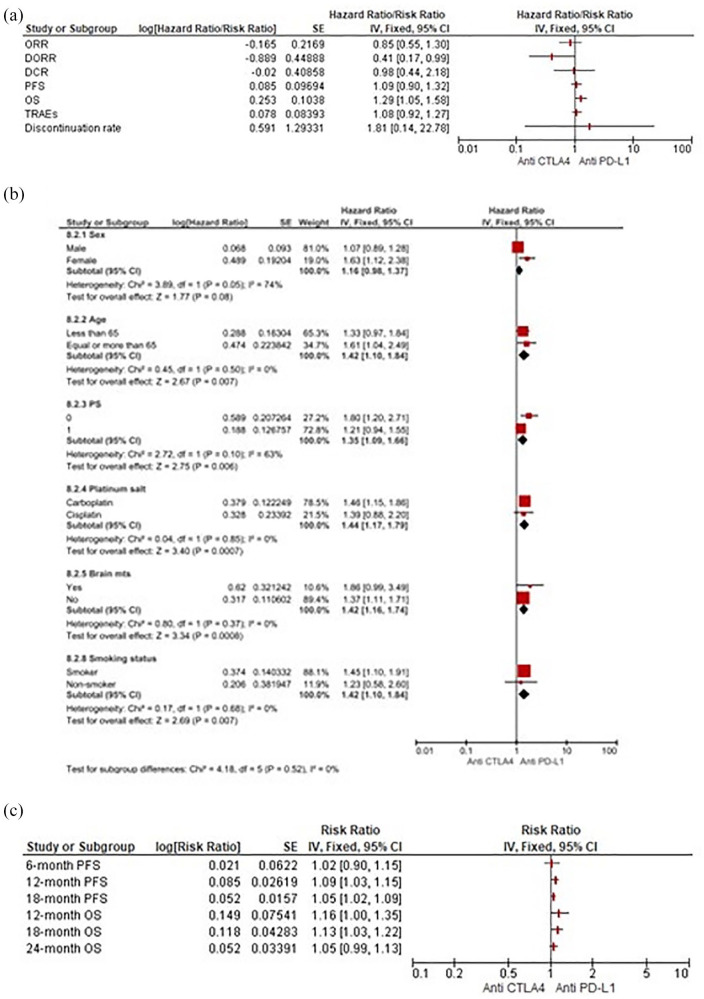
Figure 7.
(a) Forest plots for indirect comparisons between anti-CTLA-4 and anti-PD-L1 agents according to efficacy and safety outcomes. (b) Along with subgroup. (c) Landmark survival analyses.
CI, confidence interval; PD-L1, programmed death ligand 1; CTLA-4, cytotoxic T lymphocyte-associated antigen-4; IV, inverse-variance; SE, standard error.

