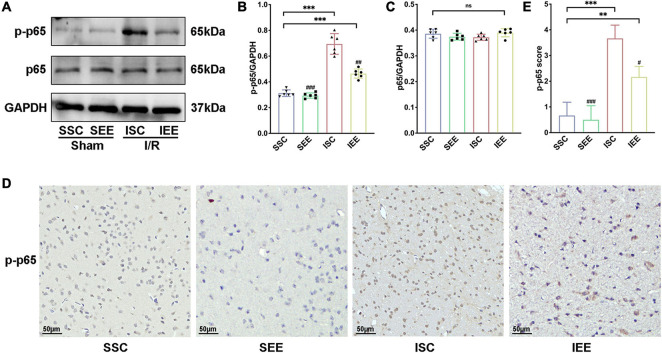
FIGURE 6.
Enriched environment inhibited p65 phosphorylation after I/R injury. (A–C) Western blots and quantification illustrating increases in the activation of NF-κB (p-p65) in the penumbra. (D) Representative IHC staining images for p-p65 in the penumbra. Scale bars, 50 μm. (E) IHC score of p-p65 in penumbra. n = 6. Data are expressed as mean ± SD. **p < 0.01, ***p < 0.001 vs. SSC group; #p < 0.05, ##p < 0.01, ###p < 0.001 vs. ISC group.

