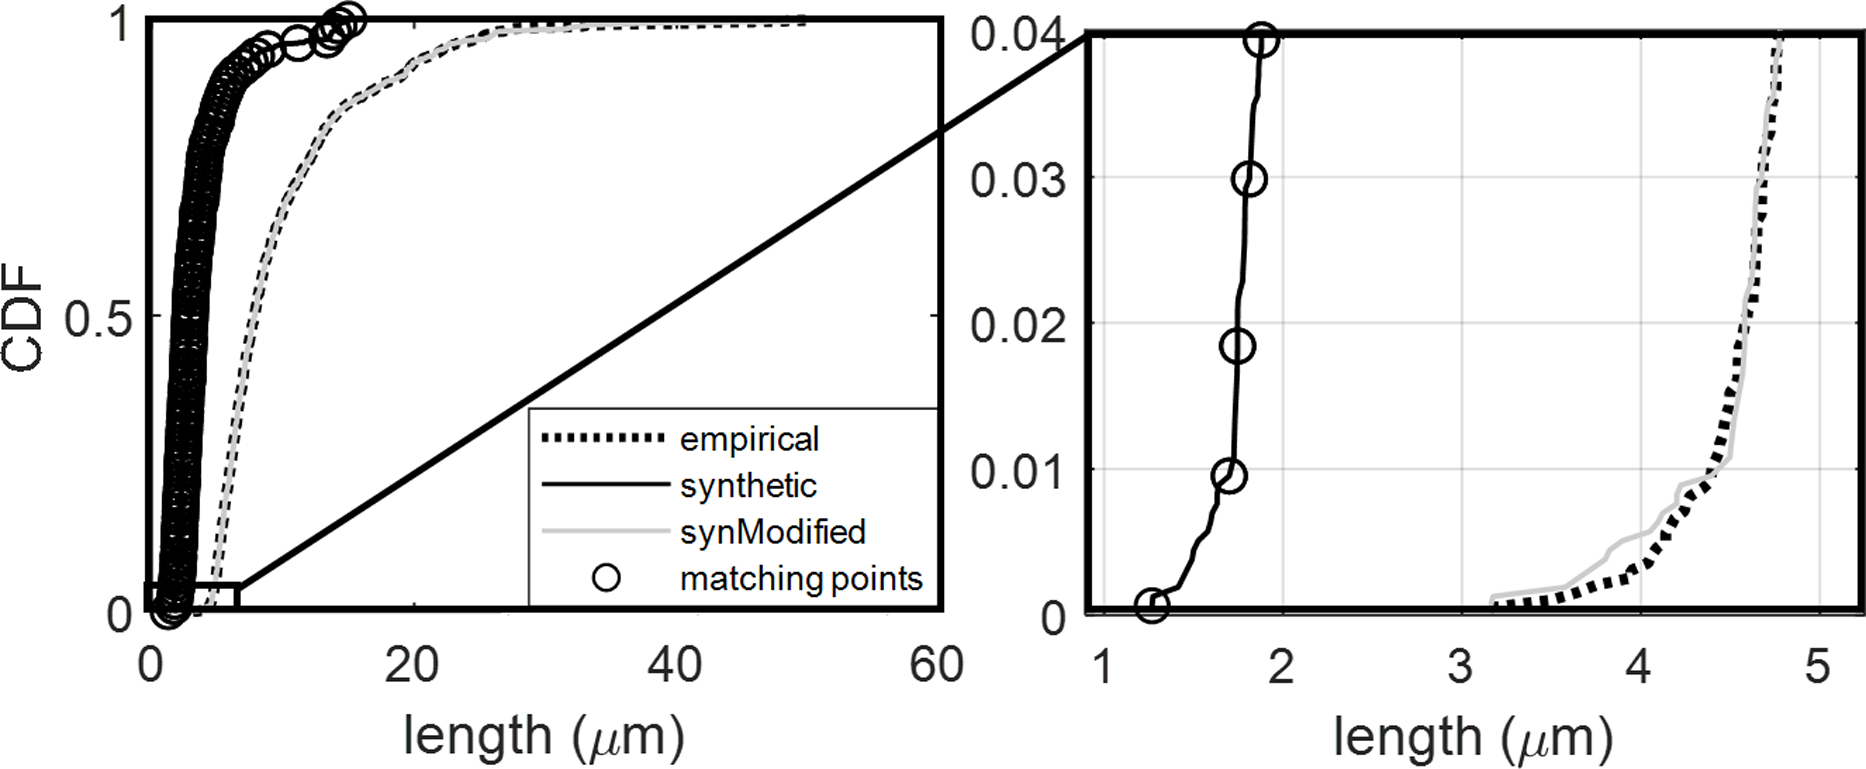
Figure D1.

Illustration of unsupervised spectrum matching method for CDFs of two datasets. The original synthetic length spectra (black solid line) shows a known degree of mismatch when compared to the target (dotted black line). When the length is matched at points designated by the black circles (N=101 points), the adjusted aVAN (gray solid line) has a much closer match to the experimental VAN CDF. The magnified first few matching points have been visualized for the example used below.
