
Figure G1.
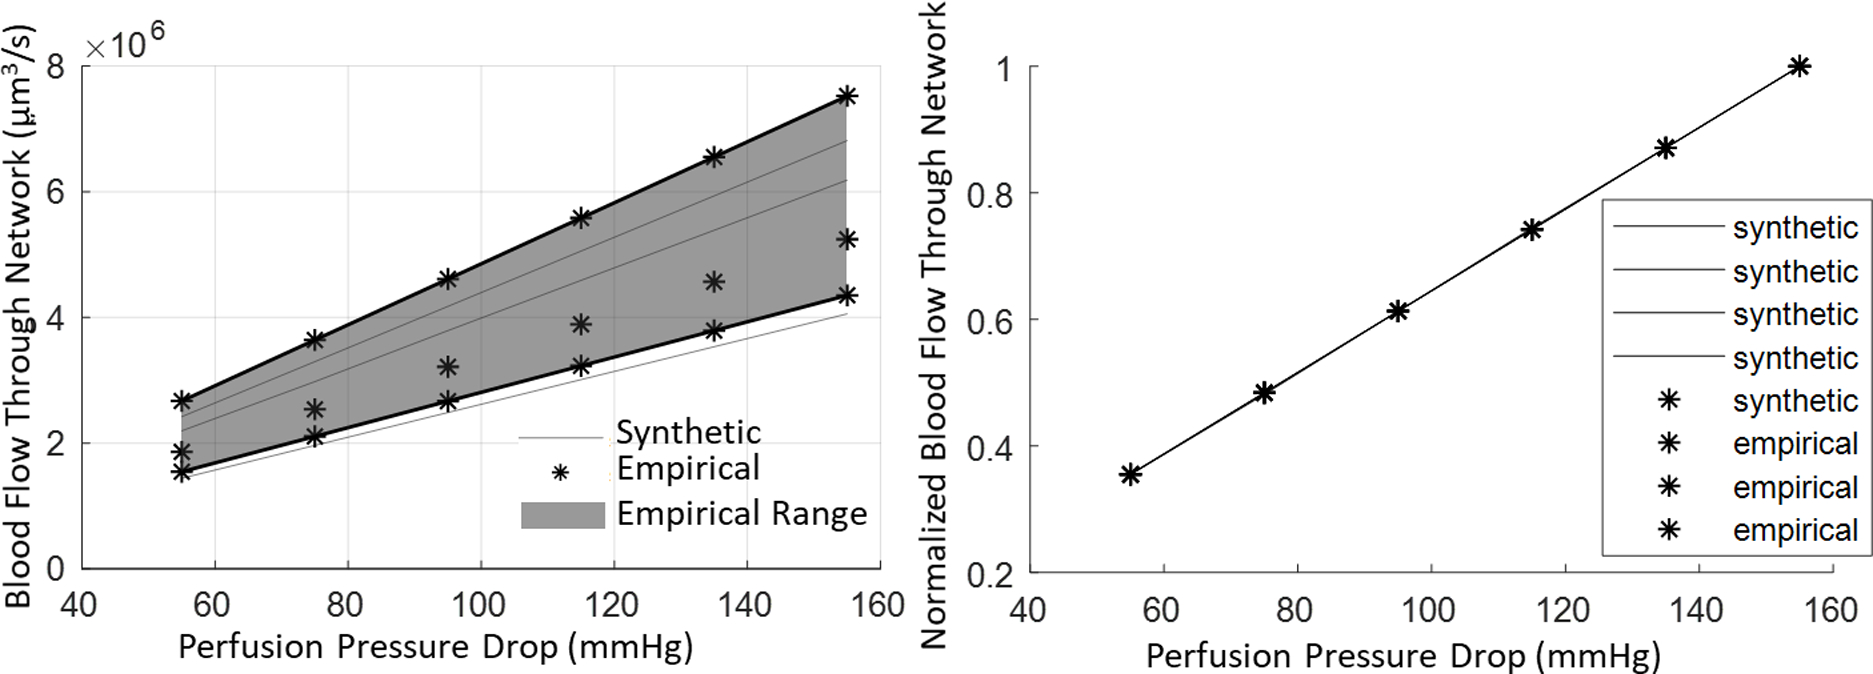
Perfusion flow rates of synthetic networks and their empirical counterparts across parametrically varied perfusion pressures. (Left) By varying the pressure, we are able to see similar performance between the empirical and synthetic VANs, where the synthetic networks receive reasonable flows when compared to their empirical counterparts. (Right) The normalized perfusion flow reflects excellent similarity between the VAN performance during pressure variability. (Normalized flow is computed as the total predicted perfusion divided by the hypothetical perfusion at 155 mmHg pressure drop as reference).