
Figure 5.
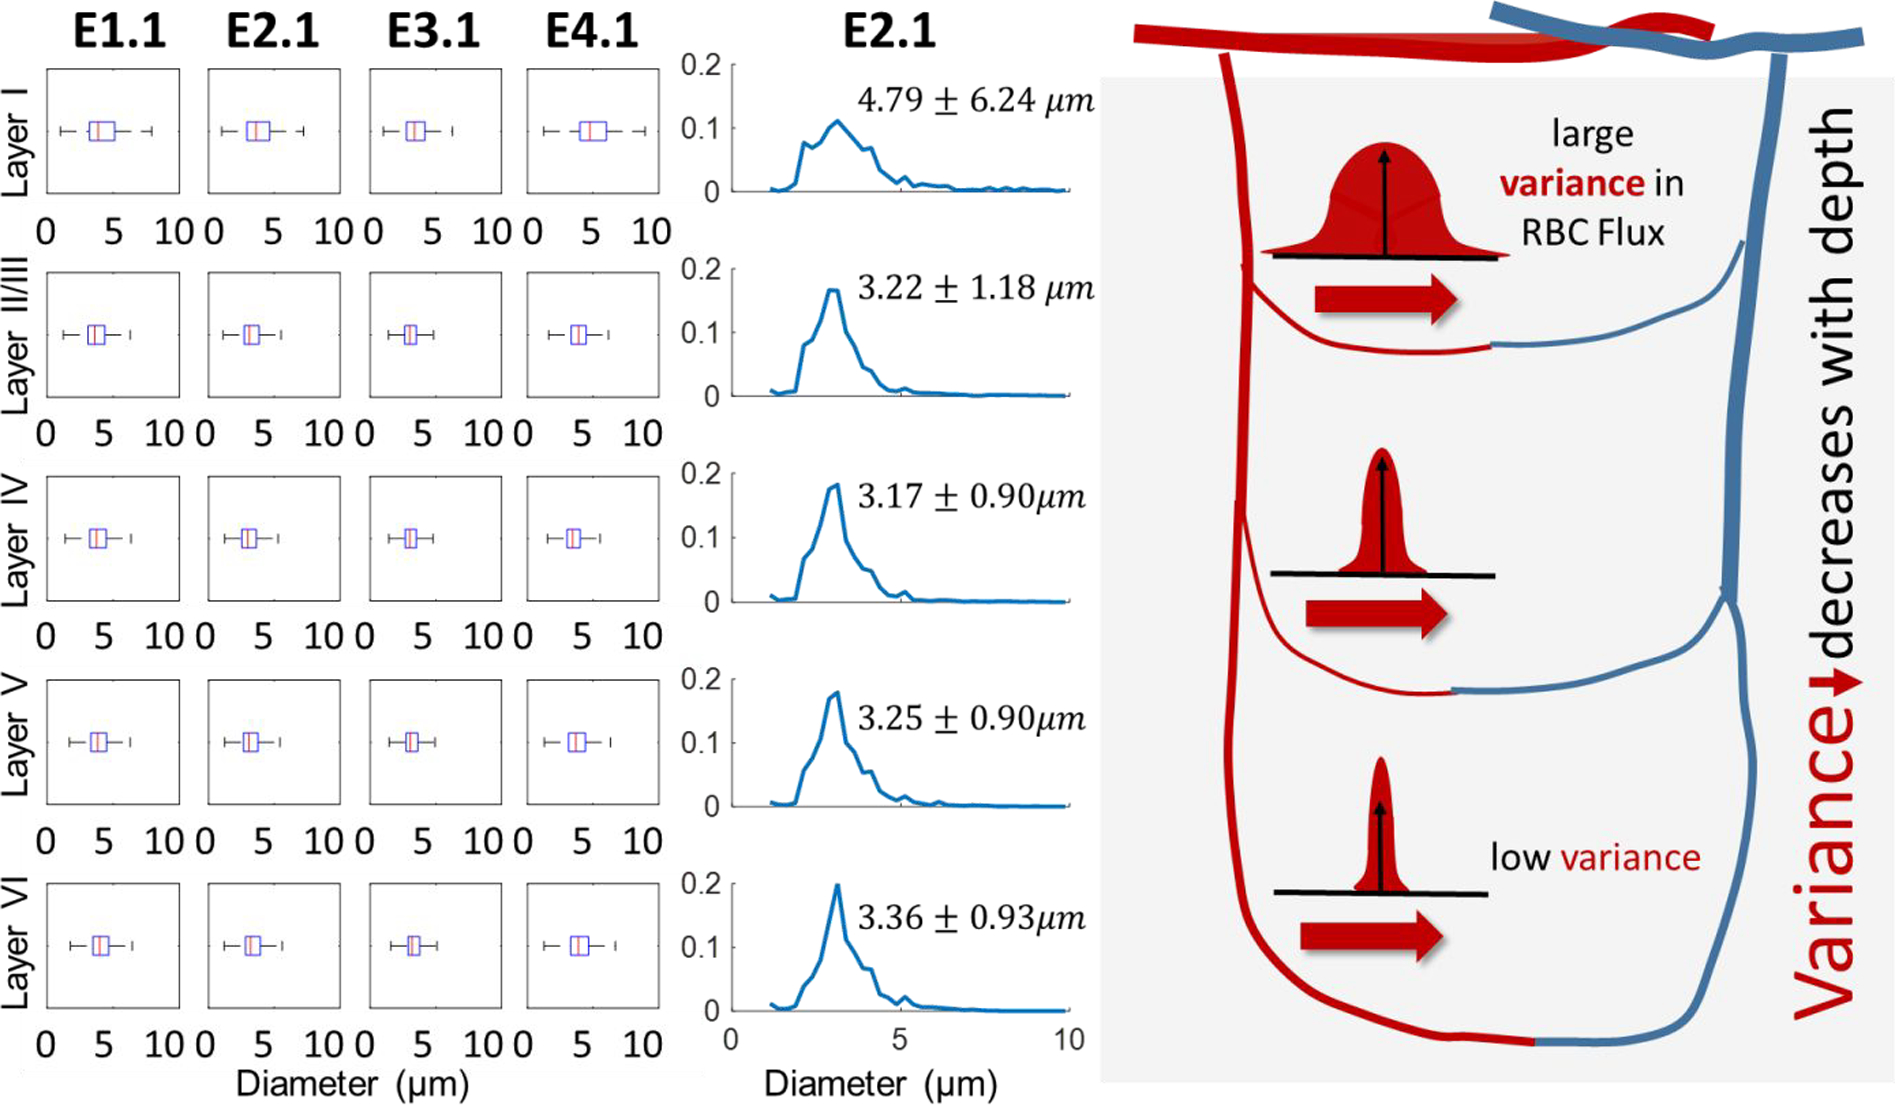
The diameter spectra in the empirical microcirculatory networks as a function of cortical depth of the Kleinfeld cohort (E1.1-E4.1). Variability in diameters decreases in deeper tissues as indicated by the boxplots showing the layer-dependent diameter distributions in four empirical networks (E1.1, E2.1, E3.1, E4.1). The spectra (shown for E2.1, in middle column) exhibit much higher diameter variability in upper cortical layers (standard deviation of 6.24 and 1.18 μm in layers I-II) than deeper regions (standard deviation of ~0.9 μm in layers IV-VI). The more uniform diameter spectra in lower layers may be a factor leading to increased homogeneity in hemodynamic properties in the same layers, such as RBC flux and hematocrit. This phenomenon is illustrated conceptually in the right panel showing RBC flux variability as a function of cortical depth and is discussed in detail elsewhere17. In general, there seems to be more order in deeper layers of the cortex compared to the surface.