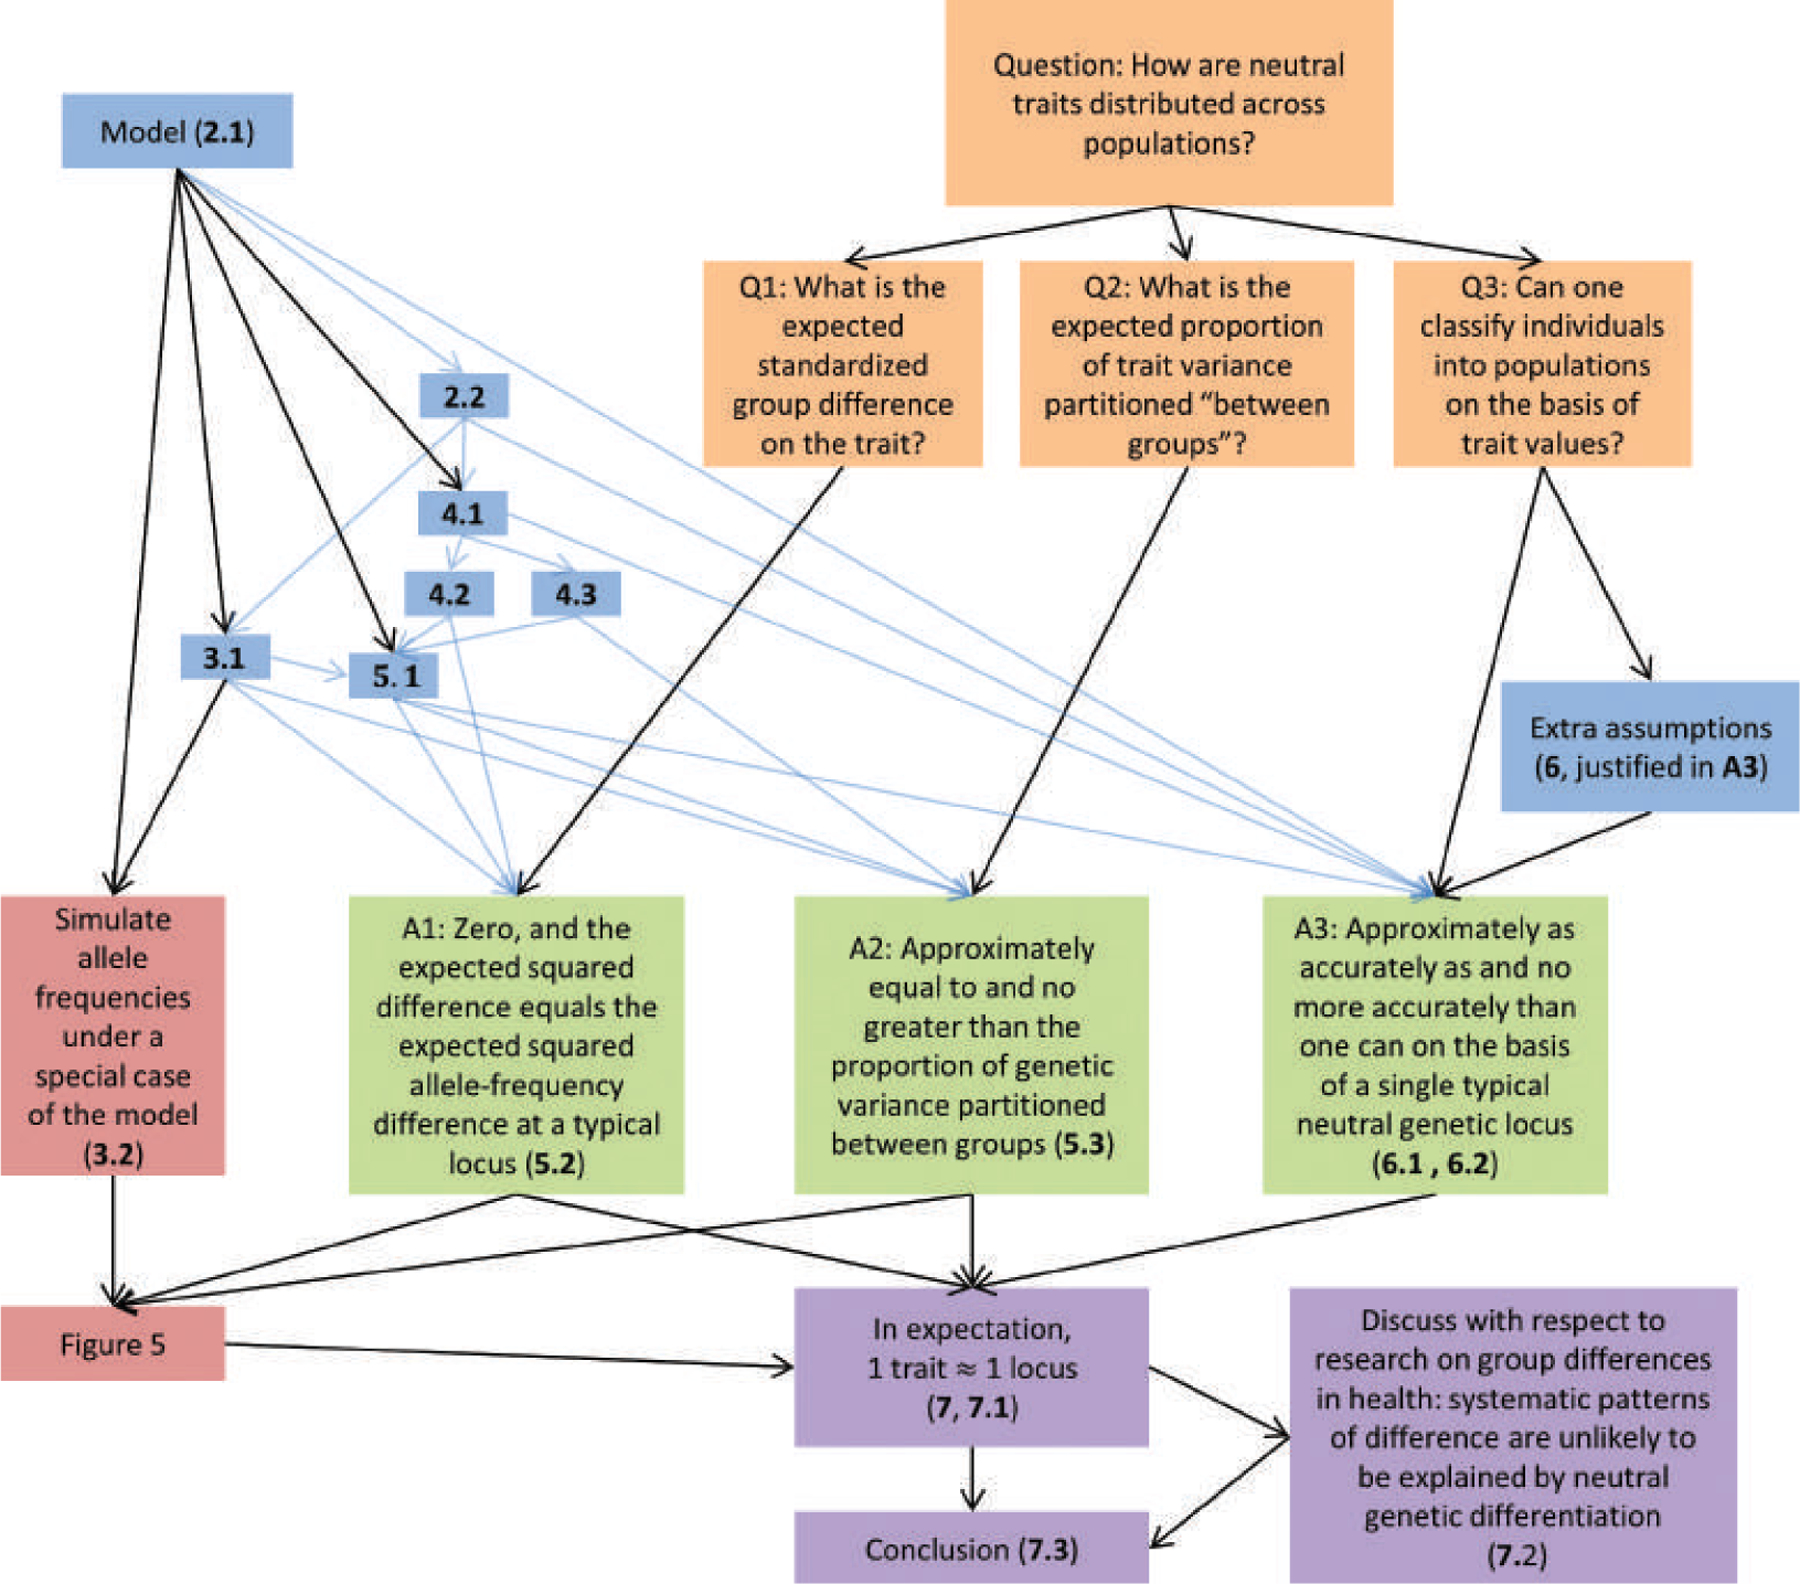
FIGURE 1.

A conceptual map of this article. For boxes that correspond to specific subsections of the article, the subsection number is displayed in bold. Arrows indicate conceptual dependence, with blue arrows indicating that a subsection cites mathematical results obtained in another subsection. Motivating questions are in orange, mathematical machinery is in blue, simulations are in red, mathematical answers are in green, and interpretation of results is in purple.
