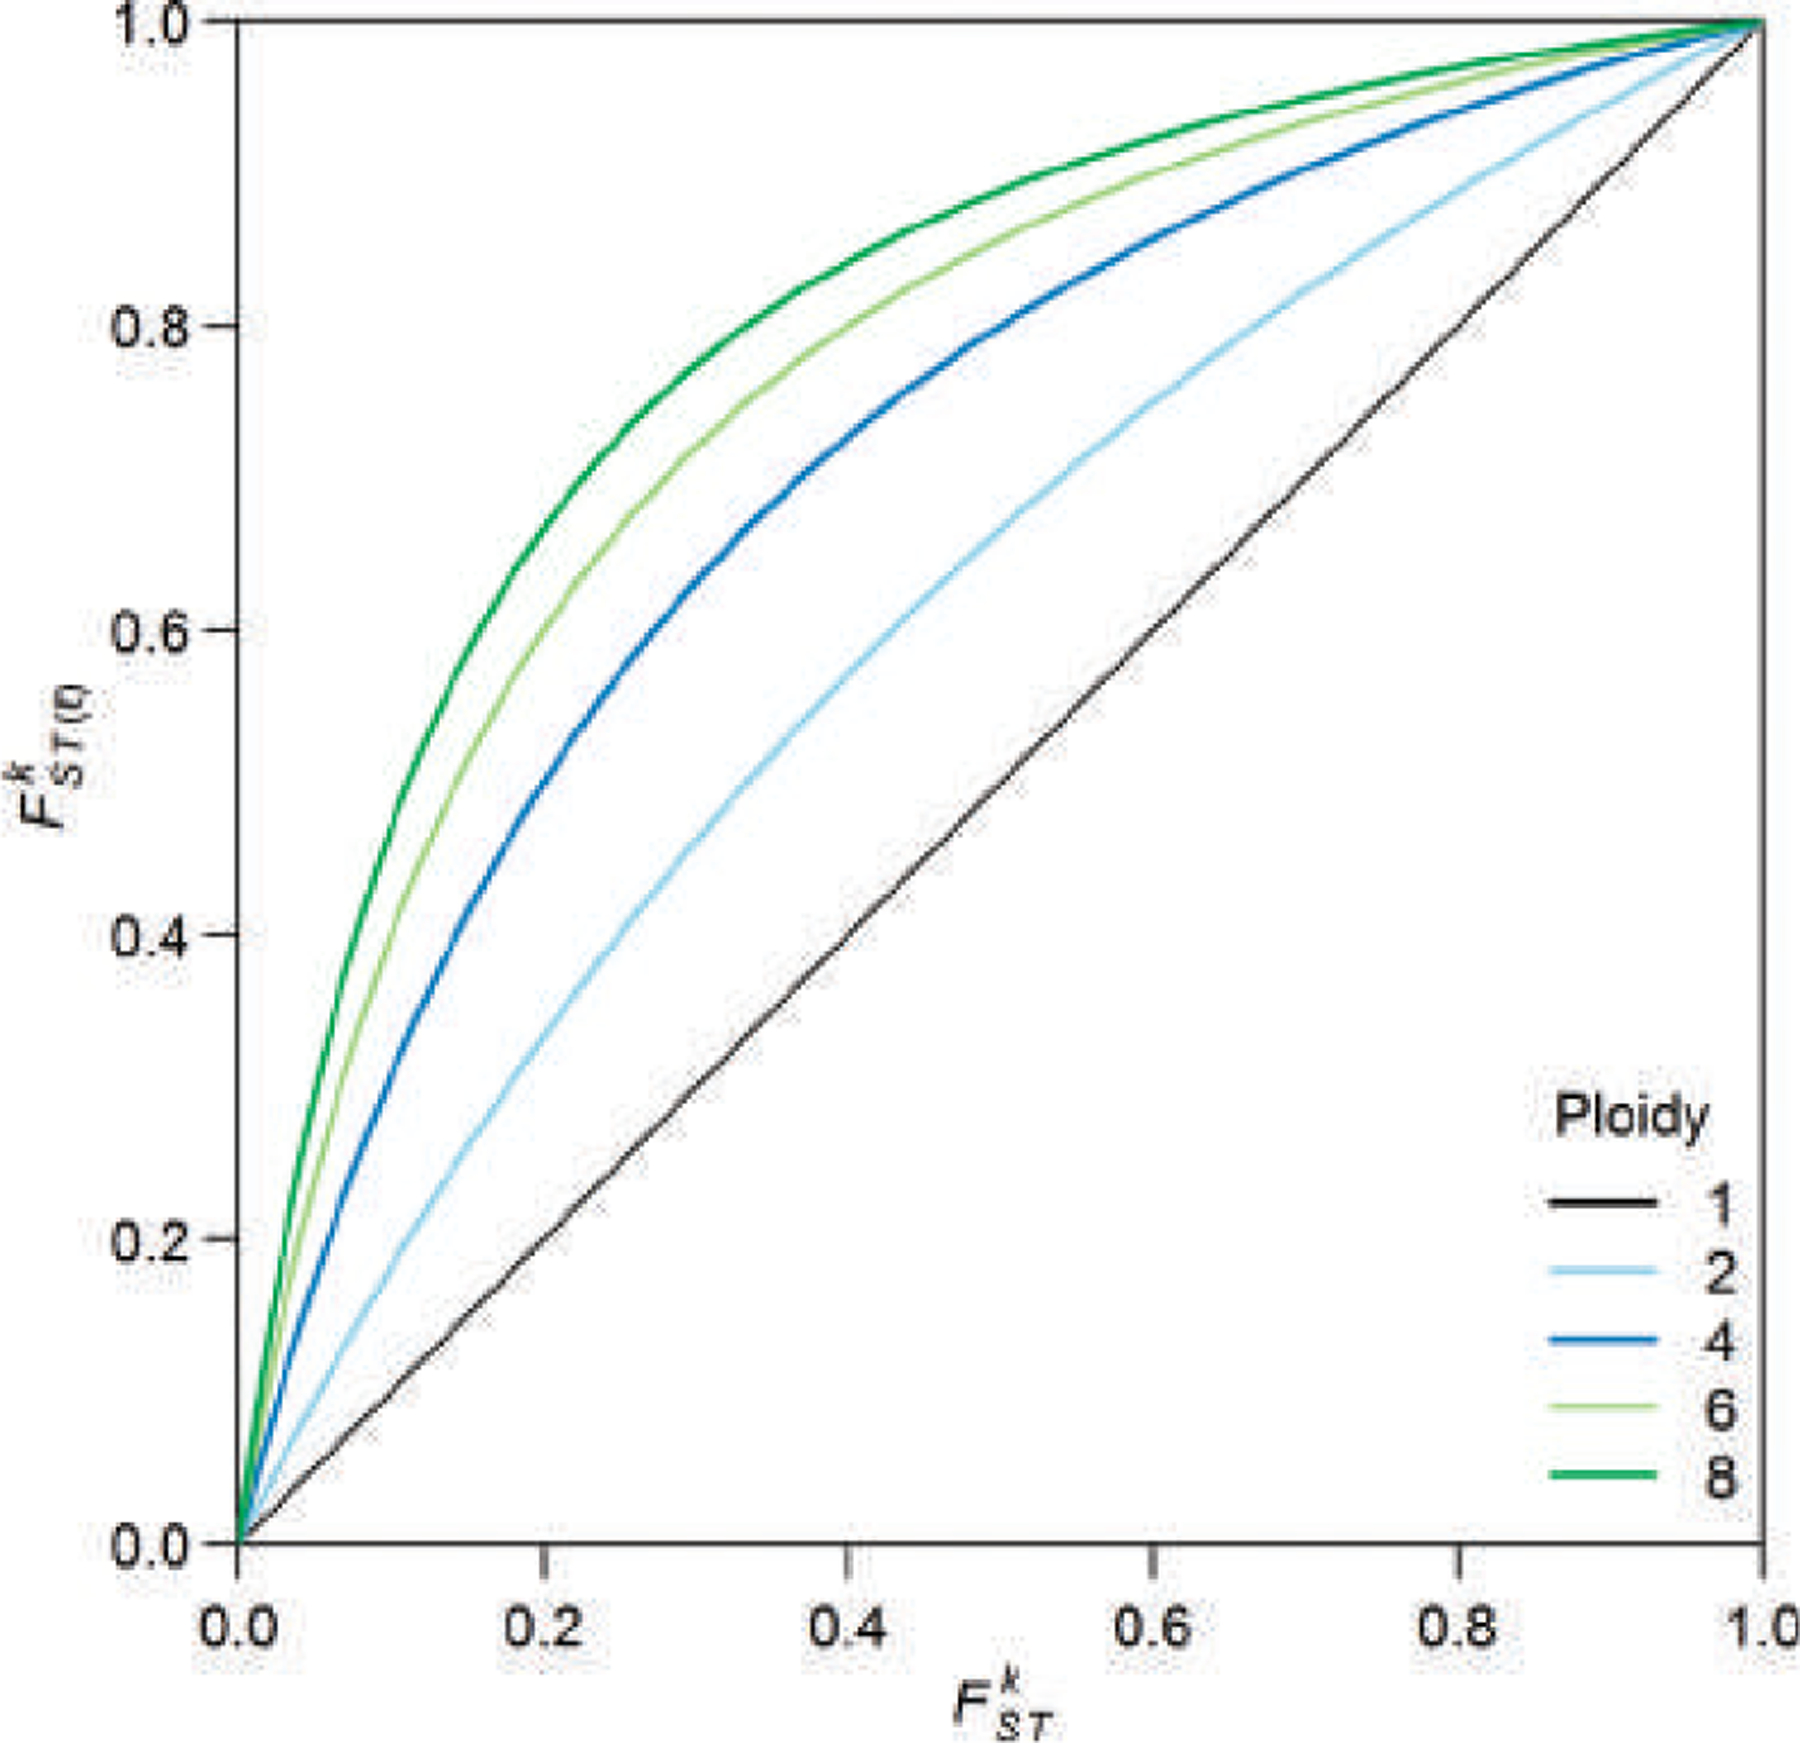
FIGURE 3.

The relationship between (Eq. 14), which partitions the variance of allelic indicator variables representing a single copy of each locus, and (Eq. 16), which partitions the variance of sums of ℓ allelic indicator variables at each locus. Thus, for haploids (ℓ = 1), . For higher ploidy, , with if and only if or (see Appendix 1). The plot is obtained from Eq. A1.4.
