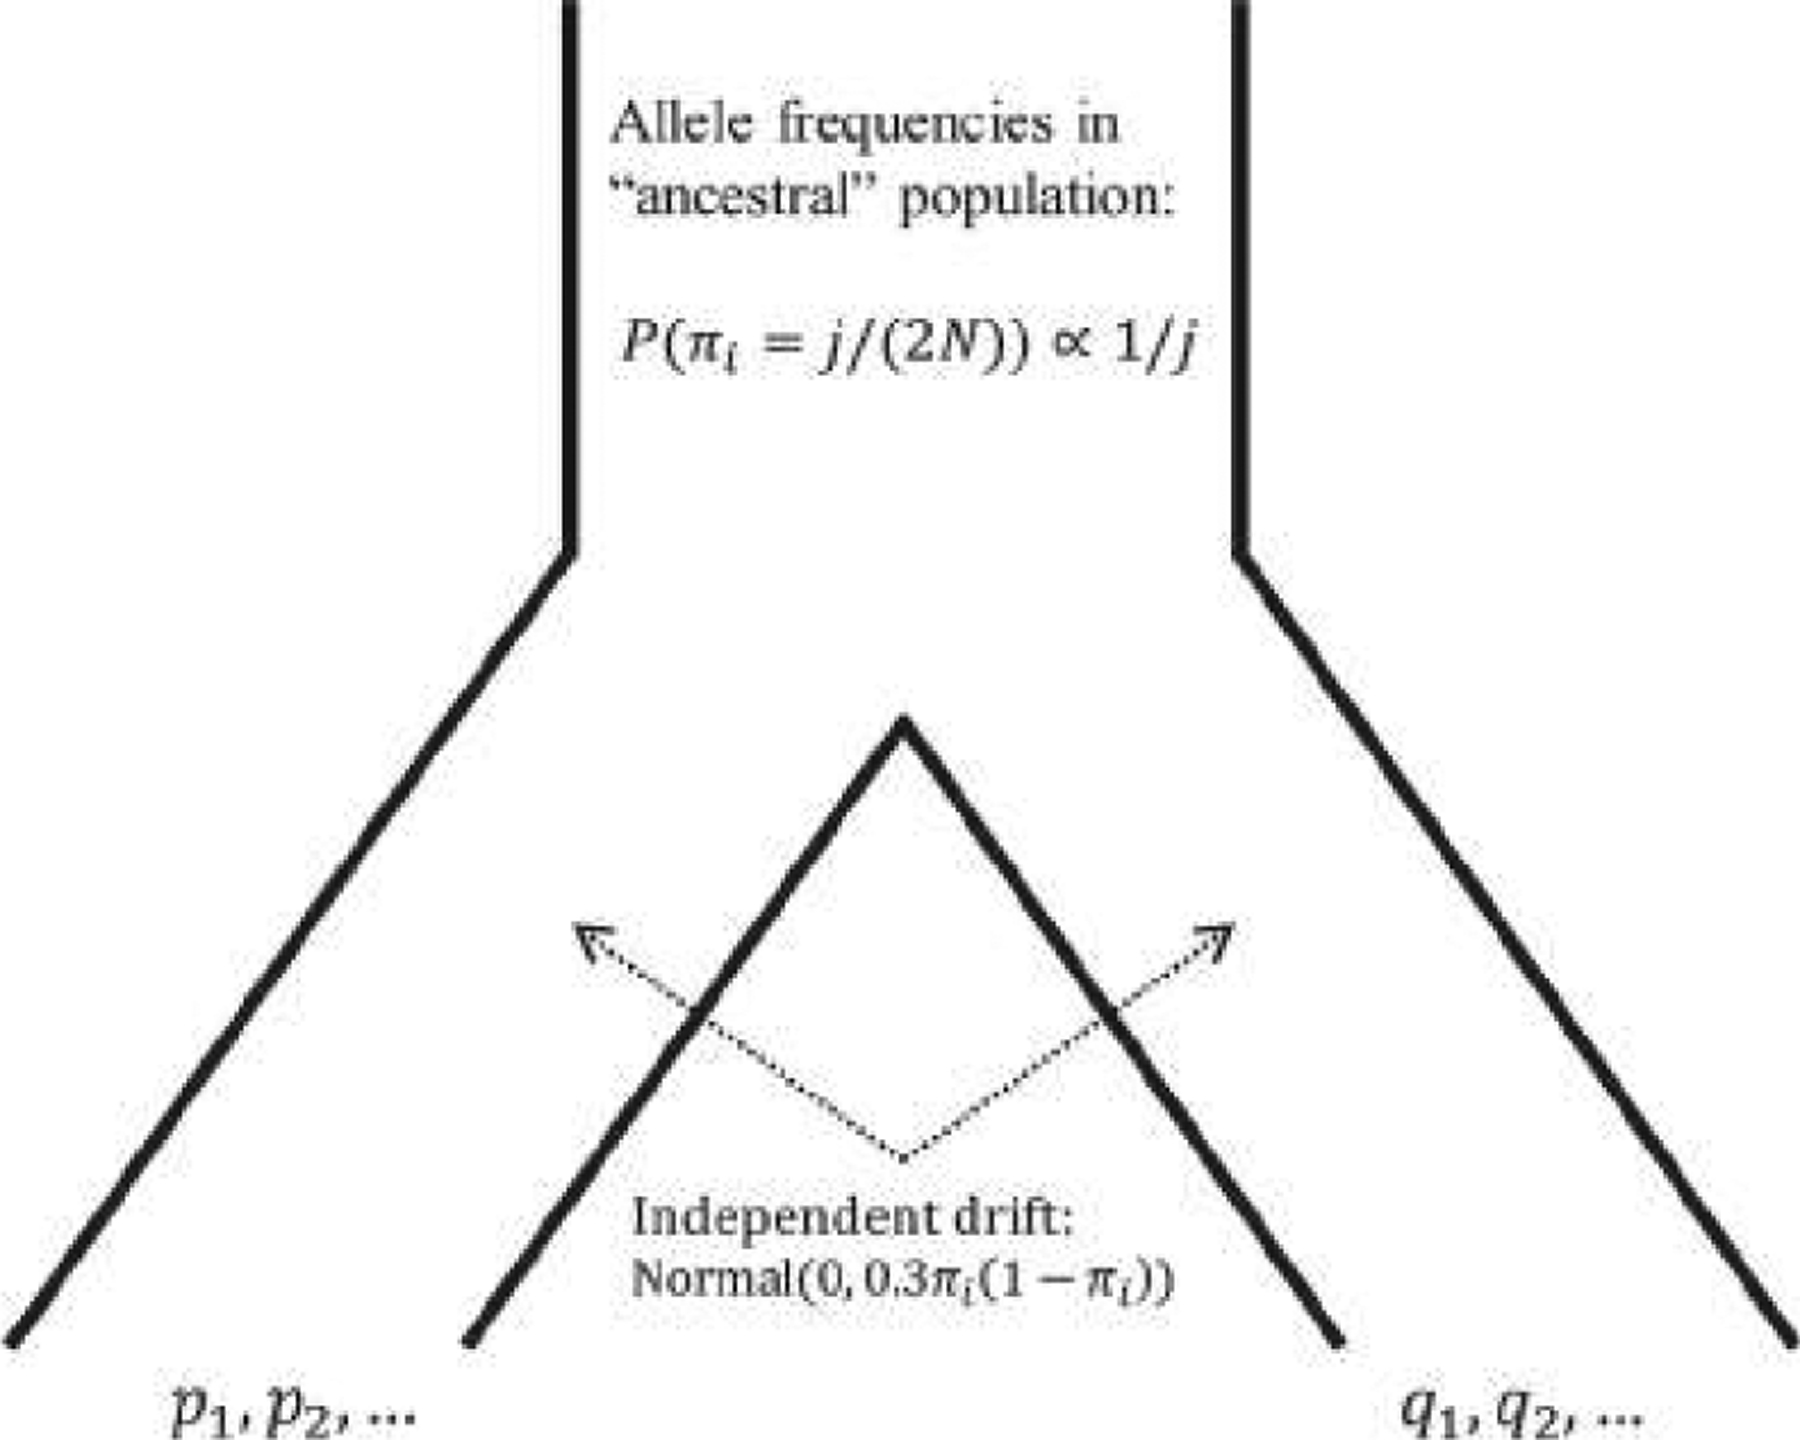
FIGURE 4.

A schematic of the drift model used to simulate allele frequencies (see Section 3.2). Derived allele frequencies in an “ancestral” population are drawn according to the neutral site frequency spectrum. Following a split, the two subpopulations drift independently, with the drift represented by a truncated normal variate with expectation 0. After drift, for each locus i, the allele with greater frequency in population B than in population A is identified, its frequency in population A is labeled pi, and its frequency in population B is labeled qi.
