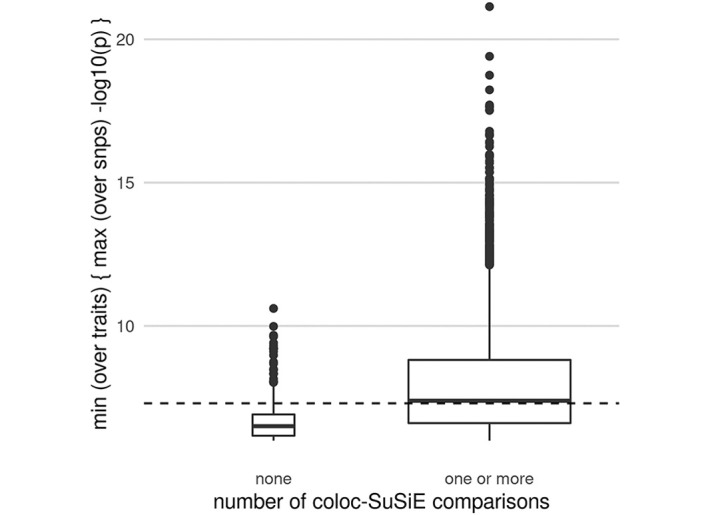
Fig 2. Distribution of maximum -log10 p values for simulated datasets where coloc-SuSiE could find at least one credible set for each trait, or could not.

Each dataset was summarised by its maximum -log10 p value, and the pair of datasets by the minimum of these. A dashed line shows the conventional GWAS significance threshold of 5 × 10⁻⁸. This shows that when coloc-SuSiE does not produce any results it is generally in cases of lower power.
