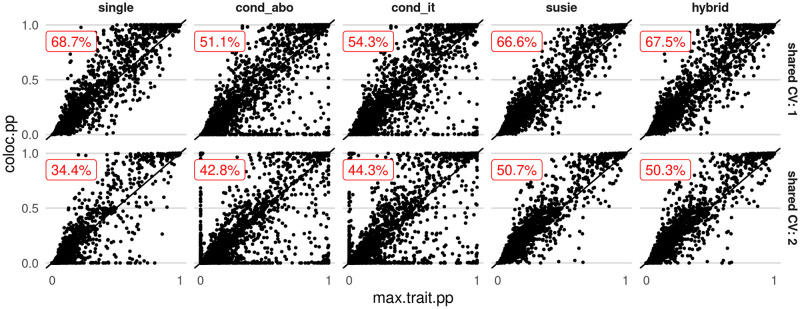
Fig 4. Fine mapping posterior probabilities at causal variants in single trait and coloc analysis, amongst datasets with high probability of colocalisation (P(H4|Data) > 0.9) according to the method shown.
Each point represents one causal variant in a dataset; its x location shows its maximum fine mapping posterior probability (PP) in either single trait, its y location shows its PP after coloc. Results are divided by rows into those from datasets with 1 (top) or 2 (bottom) causal variants, and by columns according to method. The text in red shows the percent of datasets which led to an increase in PP at causal variants after coloc analysis.

