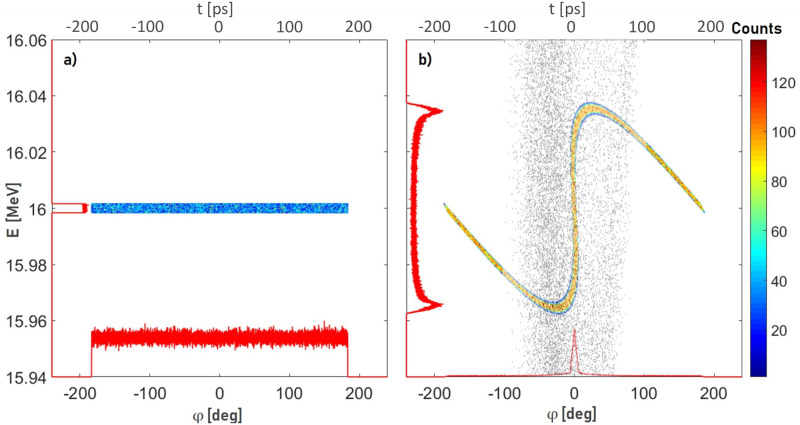
Fig 2. Longitudinal phase space between the tandem and linac.
a) longitudinal phase space at z1 (see Fig 1) coming from the tandem (Ekin = 16 MeV, ΔEkin = 0.01%) [18] b) longitudinal phase space in front of the linac at z2 (see Fig 1) (colored dots) and accepted phase space of the linac (grey dots). The red curves along the x- and y-axes are projections of the particle distributions.

