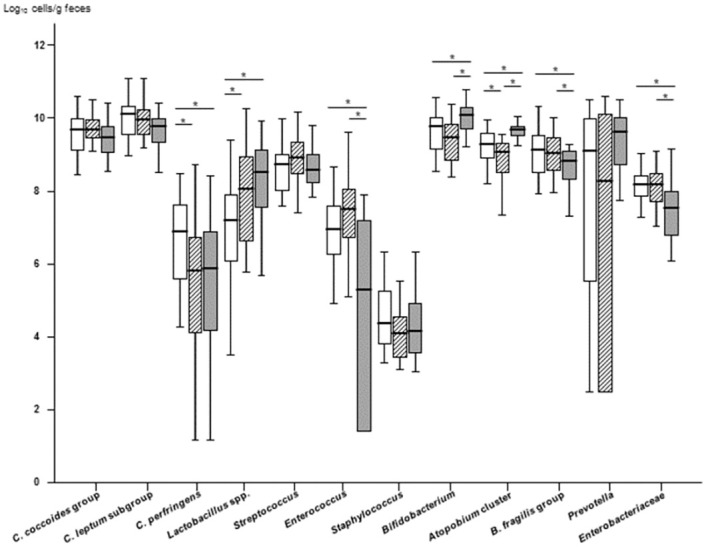
Fig 2. Box plots showing the abundance of bacteria in the gut microbiota of the three study groups.

Phylum Firmicutes: Clostridium coccoides group, C. leptum subgroup, C. perfringens, Lactobacillus spp., Streptococcus, Enterococcus, and Staphylococcus; phylum Actinobacteria: Bifidobacterium and Atopobium cluster; phylum Bacteroidetes: Bacteroides fragilis group and Prevotella; and phylum Proteobacteria: Enterobacteriaceae. The lines and error bars correspond to the medians ± 95% confidence intervals. White box, HIV(−) group; oblique line box, HIV(+) group; gray box, ART(+) group. *P < 0.05, Mann-Whitney U test. C. difficile and Pseudomonas were not included due to the low detection frequencies (3.4% to 20% in all three groups; C. difficile, median = 1.15 log10 cells/g feces, and Pseudomonas, median = 1.45 log10 cells/g feces, S2 Table).
