
FIGURE 5.
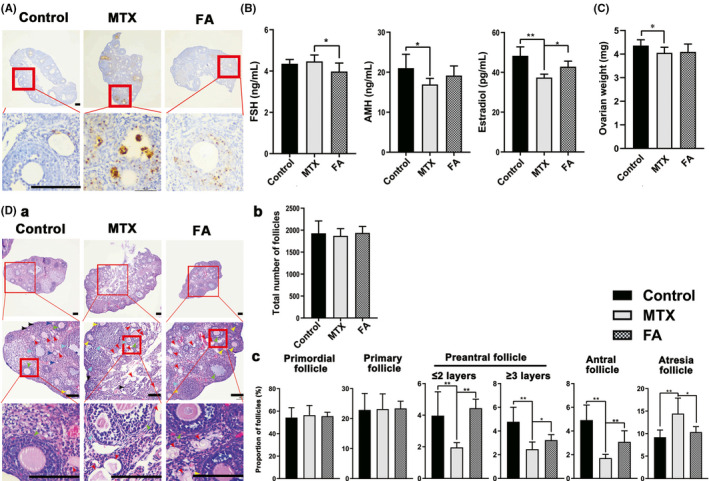
Granulosa cells (GCs) apoptosis in mice ovaries due to methotrexate (MTX) led to follicular dysplasia. (A) Apoptotic GCs in the ovaries, apoptotic GCs appear brown. Apoptotic GCs were already visible in both primary and secondary follicles. Folic acid (FA) treatment could decrease the proportion of apoptotic GCs dramatically. (B) Hormone levels in the serum. MTX administration decreased the estradiol and anti‐Müllerian hormone (AMH) significantly, and FA treatment restored the level of estradiol in mouse serum instead of AMH. (C) The ovary weight of the MTX group decreased compared with the control group. (D) (a) Representative images of hematoxylin‐eosin (H&E)‐stained serially sectioned ovaries. No significant pathological changes were found in the mouse ovaries after MTX administration. Follicles at different stages are indicated with arrows. Atresia follicles (red), primordial follicles (grey), primary follicles (dark blue), pre‐antral follicles (≤2 layers GCs, yellow; greater than 2 layers GCs, light blue), and antral follicles (green). (b) Statistical chart showing the total number of follicles. No difference was observed among the three groups. (c) Statistical chart showing the percentage of follicles at different stages in three groups. Although there was no significant difference in the proportion of primordial follicles and primary follicles among the three groups, the percentage of atresia follicles in the MTX group increased significantly. In contrast, that of the pre‐antral follicles and antral follicles decreased. FA treatment decreased the proportion of the atresia follicles and increased that of pre‐antral and antral follicles. (*p < 0.05, **p < 0.01, Student’s t‐test, n = 6; Scale bars: 50 μm)