FIGURE 3.

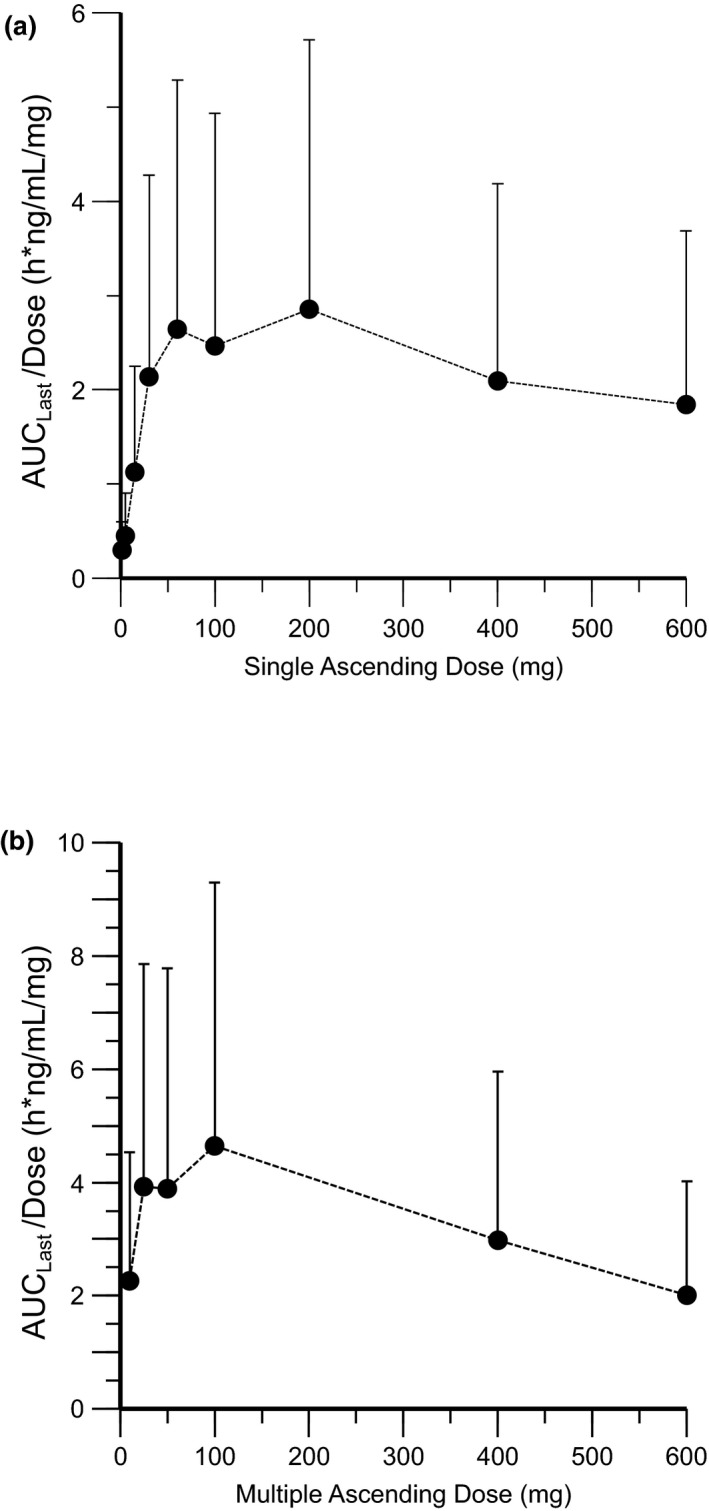
Dose‐exposure relationship of remibrutinib for dose normalized AUClast (Geo‐mean ±SD). (a) Single ascending dose cohorts, and (b) multiple ascending dose cohorts (q.d. only). AUC, area under the curve

Dose‐exposure relationship of remibrutinib for dose normalized AUClast (Geo‐mean ±SD). (a) Single ascending dose cohorts, and (b) multiple ascending dose cohorts (q.d. only). AUC, area under the curve