
FIGURE 2.
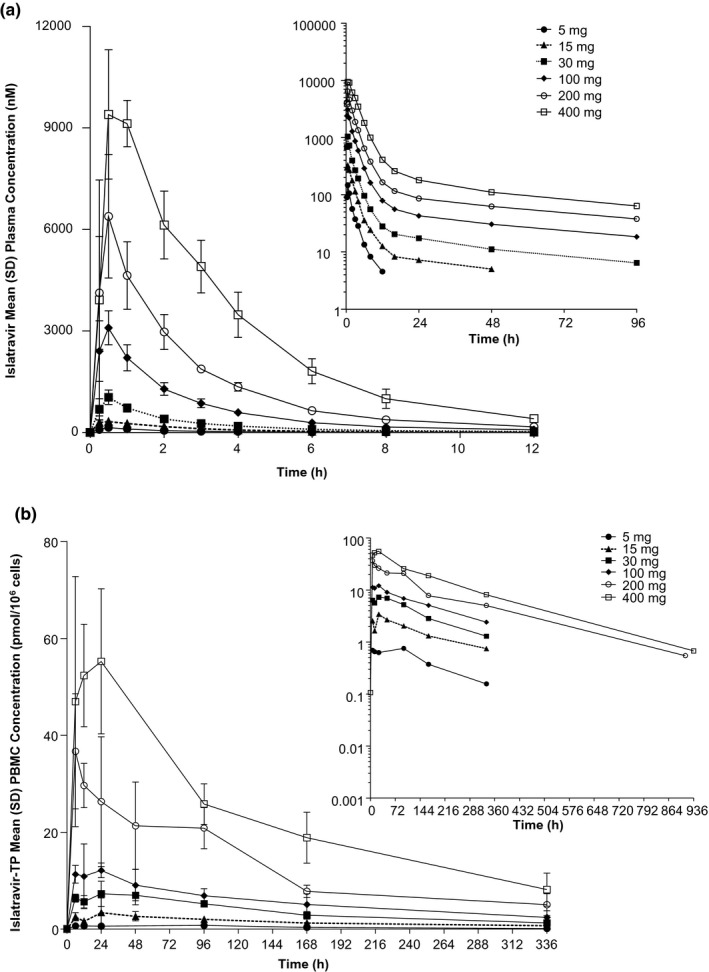
Concentration‐time profiles. (a) Arithmetic mean (±SD) plasma concentration versus time profiles of plasma islatravir following administration of single oral doses of 5–400 mg islatravir in the fasted state to participants without HIV (n = 6/panel); inset: semi‐log plot. (b) Arithmetic mean (±SD) PBMC concentration versus time profiles of islatravir‐TP following administration of single oral doses of 5–400 mg islatravir in the fasted state to participants without HIV (n = 6/panel); inset: semi‐log plot. PBMC, peripheral blood mononuclear cell; SD, standard deviation; TP, triphosphate