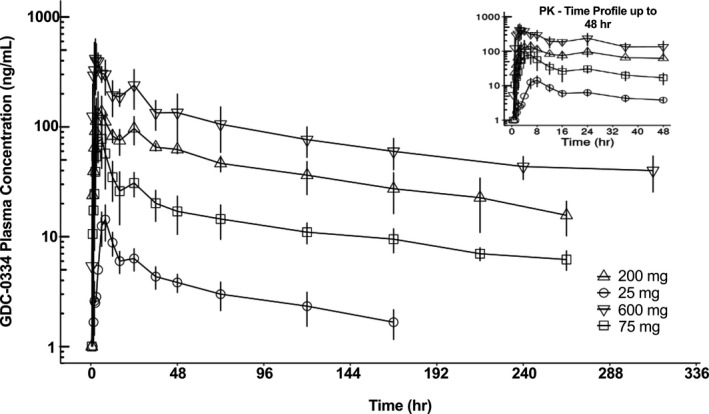
FIGURE 1.

Plasma concentration‐time profiles of GDC‐0334 in humans after single ascending dose under fasting condition show increasing GDC‐0334 plasma concentrations associated with the ascending dose levels. Symbols = arithmetic mean +/‐ SD per nominal sampling time per treatment group; lines = PK‐time profile per treatment group. The inset figure only displays data up to 48 h postdose. PK, pharmacokinetic
