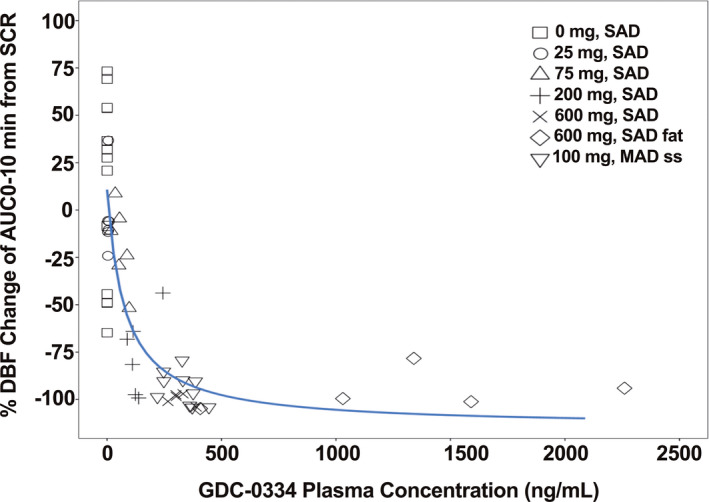
FIGURE 2.

Observed pharmacokinetic‐pharmacodynamic (PK‐PD) relationship from the clinical study demonstrates the inhibition of allyl isothiocyanate (AITC)‐induced dermal blood is dose proportional to the plasma concentrations of GDC‐0334. DBF, dermal blood flow; AUC0–10 min, area under the curve from time 0 to 10 min; SCR, baseline data from screening period; SAD, single ascending dose; MAD, multiple ascending dose; ss, steady state; solid black line, nonlinear regression curve fit line. Data partially published previously: ©2020 Balestrini et al., J Exp Med. 2021; 218(4):e2021637 10
