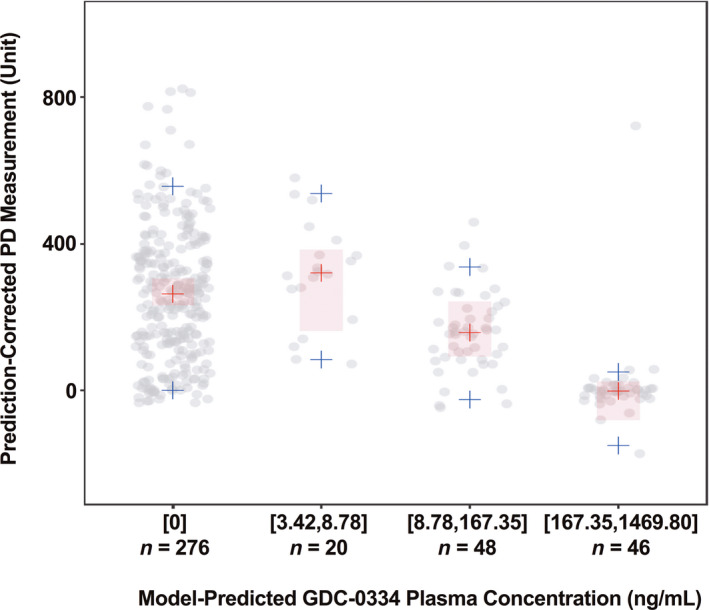
FIGURE 3.

Prediction‐corrected visual predictive check of final pharmacokinetic‐pharmacodynamic (PK‐PD) model. Observed data (gray circles), observed median (red crosses), observed 5th and 95th percentiles (blue crosses); 95% prediction interval (PI; 1000 replicates) of median (red shaded areas); 95% PI for 5th and 95th percentiles not displayed due to large PI; n = sample size (by allyl isothiocyanate [AITC] application location, arm, occasion, and subject), bracket = inclusive, parenthesis = exclusive
