
FIGURE 3.
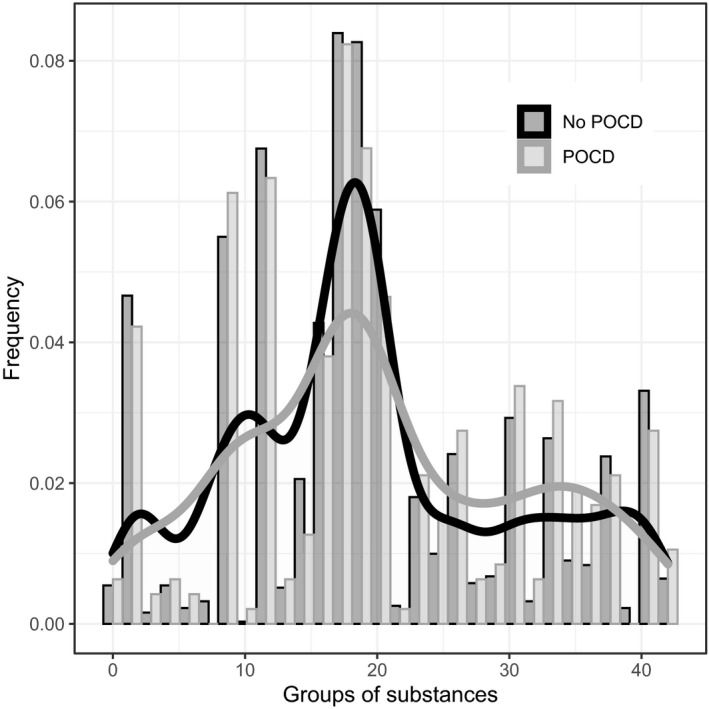
Illustration of frequencies of the groups of substances of the preoperative long‐term medication in regard to POCD. Groups of substances according to Anatomical Therapeutic Chemical classification system. 24 For an overview of the groups, see Table S2. Presentation as bar plots: grey = POCD and black = no POCD. The density is additionally shown as a graph. POCD, postoperative (neuro‐)cognitive disorder