. 2021 May 31;14(5):2008–2016. doi: 10.1111/cts.13059
© 2021 The Authors. Clinical and Translational Science published by Wiley Periodicals LLC on behalf of the American Society for Clinical Pharmacology and Therapeutics.
This is an open access article under the terms of the http://creativecommons.org/licenses/by-nc-nd/4.0/ License, which permits use and distribution in any medium, provided the original work is properly cited, the use is non‐commercial and no modifications or adaptations are made.
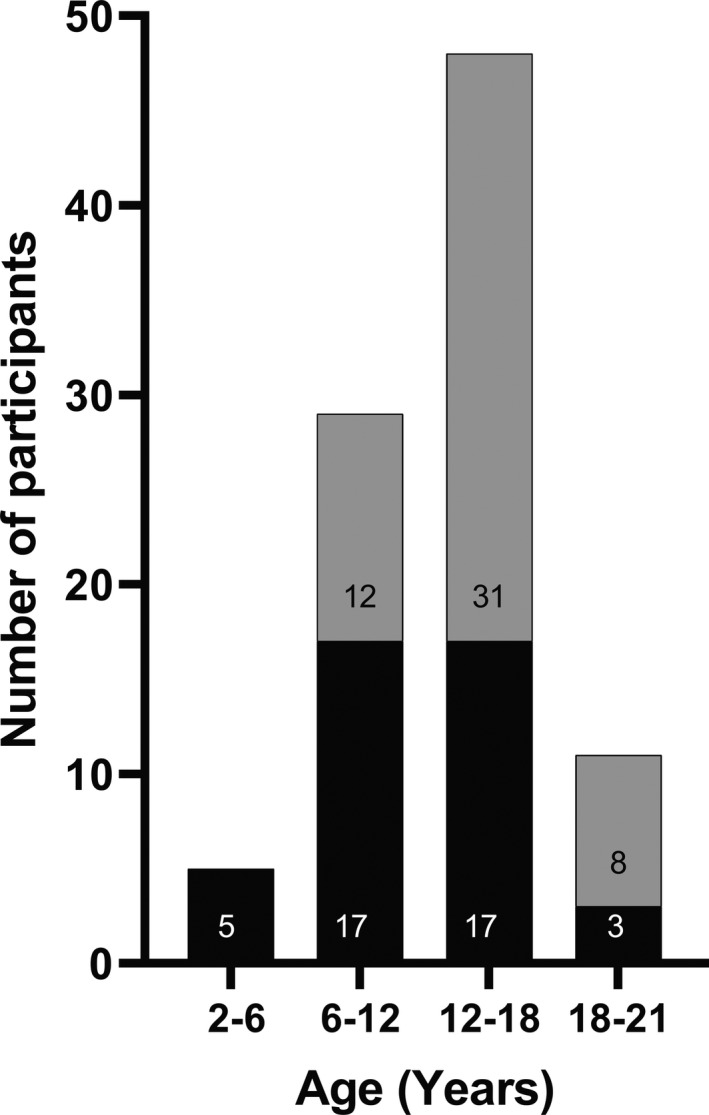
FIGURE 3.

Age distribution of datasets 1 (black bars) and 2 (grey bars)
