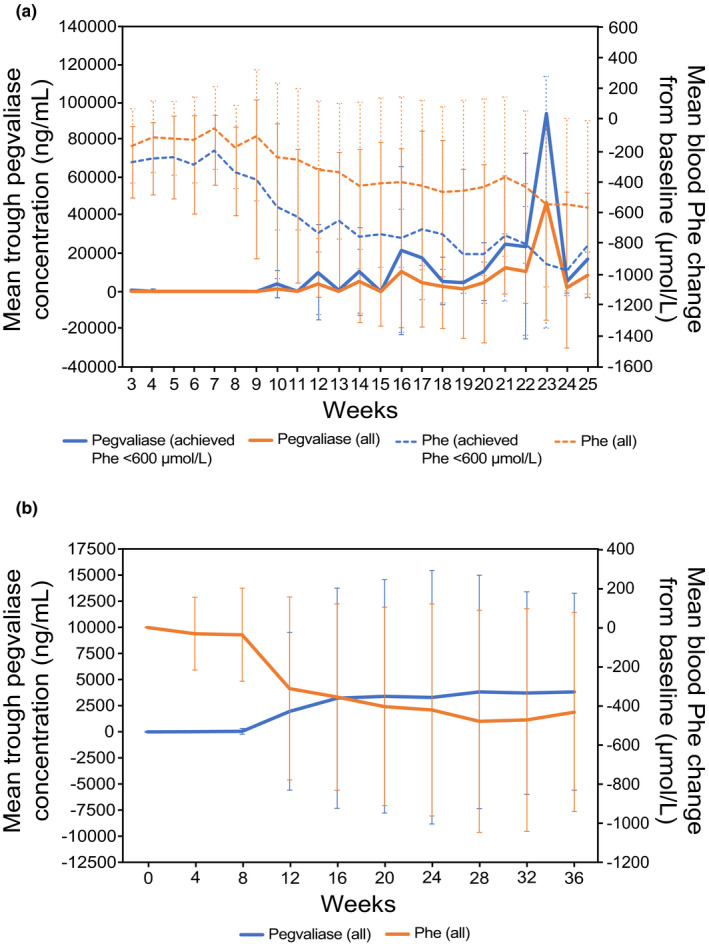
FIGURE 2.

Mean ± SD pegvaliase C trough and Phe concentrations over time. (a) The 24‐week, open‐label phase II study PAL‐165–205 (N = 24) used an induction (2.5 mg/week) phase, followed by dose titration (5–75 mg/day) and maintenance dosing (dose at which patients sustained Phe ≤ 600 µmol/L) in adults with PKU. The figure shows pegvaliase and Phe levels among all patients (All, N = 24) and those who achieved Phe less than or equal to 600 µmol/L (achieved, N = 11). (b) PRISM‐1 was an open‐label, 36‐week phase III study (N = 261) in adults with PKU that used an induction phase (2.5 mg/week for 4 weeks), dose titration (randomized fixed dose of 20 or 40 mg/day for ≤30 weeks), and maintenance phase (≥3 weeks at the randomized dose). C trough, trough plasma concentration; Phe, phenylalanine; PK, pharmacokinetic; PKU, phenylketonuria
