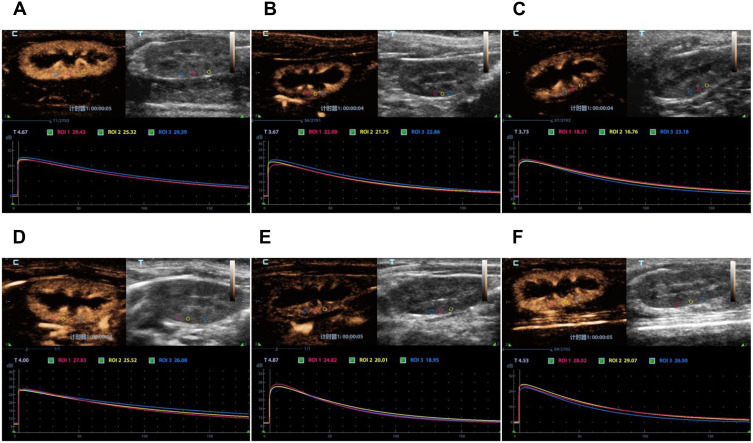
Figure 7.
Contrast-Enhanced Ultrasound images. Perfusion of renal vessels, cortex and medulla and time intensity curve about the ROI. The perfusion in CLP group was weaker than that in CLP+Cur group from a macro view. (A) Sham group at 12h. (B) CLP group at 12h. (C) CLP+Cur at 12h. (D) Sham group at 24h. (E) CLP group at 24h. (F) CLP+Cur at 24h.

