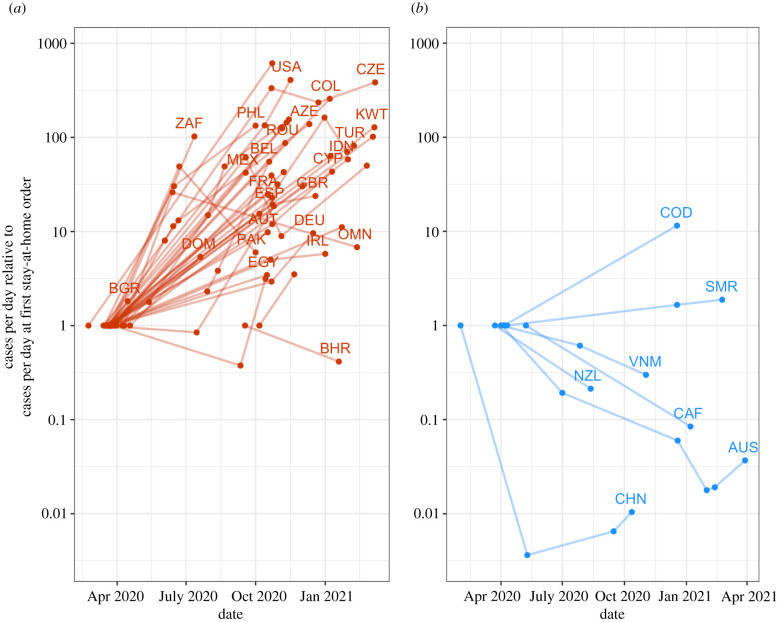
Figure 3.
Countries implement stay-at-home orders at different levels of daily confirmed COVID-19 cases as the pandemic progresses. Note: each country is represented by a line connecting multiple dots, where each dot is the beginning of a new stay-at-home order. The position on the y-axis is the number of confirmed cases per day relative to the number of cases per day when that country implemented their first stay-at-home order. (a) Countries that have averaged more than 100 new cases reported per day since April 2020; (b) countries that have averaged 100 cases or fewer per day. Countries are only included if they implemented more than one stay-at-home order and had local community transmission (greater than 10 new cases per day) when they first implemented a stay-at-home order.

