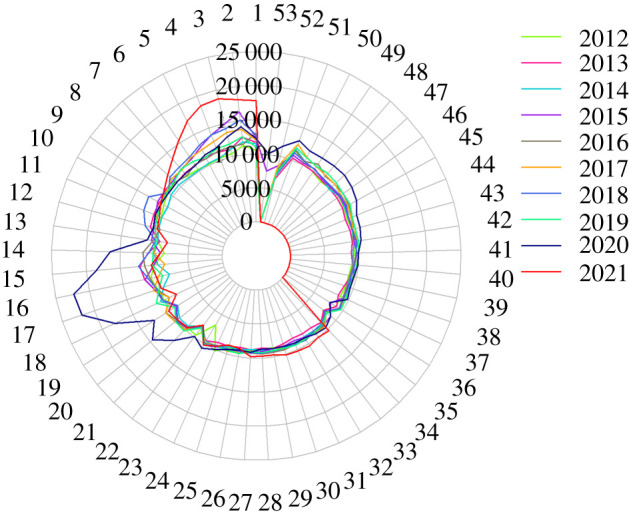
Figure 1.

Radial plot (‘Florence Nightingale’ plot) of excess deaths in England and Wales by year and week number (1–53). Data from the Office for National Statistics (ONS) during the pre-pandemic years 2012–2019 and during the pandemic in England & Wales [15]. Data for 2021 were only recorded up to week 34 at the time of plotting the Figure. Therefore, the deaths in weeks 35–52 in 2021 are zero.
