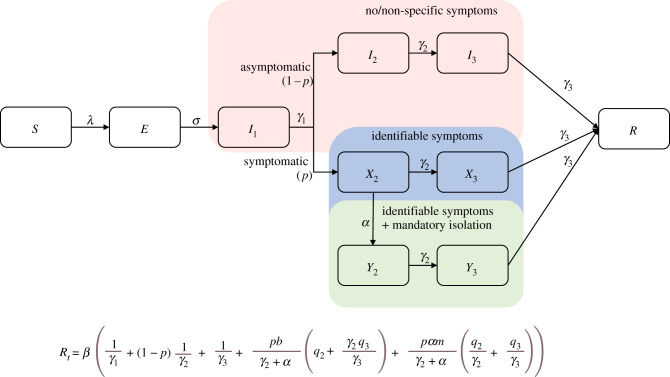
Figure 4.
The flow chart of a simple epidemic model for COVID-19 of individual states and pathways representing rates of transfer between states [25]. The top pathway is for the fraction (1 − p) of those infected who are asymptomatic, with no symptoms or non-specific, unrecognized symptoms, who stay in the community and eventually recover—but contribute to transmission. The bottom pathway is for the fraction (p) who have identifiable symptoms who either self-isolate (minimal level of behaviour change, reducing the infection rate by (1 − b)) or get admitted to hospital (mandatory self-isolation/hospitalization, which is assumed to be far more effective, reducing the infection rate by (1 − m)). I1 is the pre-symptomatic stage, during which individuals are infectious before the p fraction develop symptoms. Two phases are added to produce an Erlang distribution for time to symptoms. No social distancing or lockdown is represented in the diagram. Below the flow chart is the Rt equation that arises from this flow chart. It is defined as an effective reproduction number because self-imposed or mandatory isolation is assumed to take place. In this equation 1/α is the average number of days it takes from symptom onset to isolation. λ is the force of infection term: the rate at which susceptible individuals become infected, which is dependent on the infection rates (expected amount of people an infected person infects per day) for each infectious state in the model. The β term is the infection rate for the pre-symptomatic infectious state, while q2 and q3 are the relative increases in infection rate for symptomatic individuals in phases 2 and 3 of infection, respectively. The γ terms define rates of leaving a given state (1/γ is the average duration of stay). See electronic supplementary material, Information for the expression of λ and derivation of Rt.

