
Figure 5.
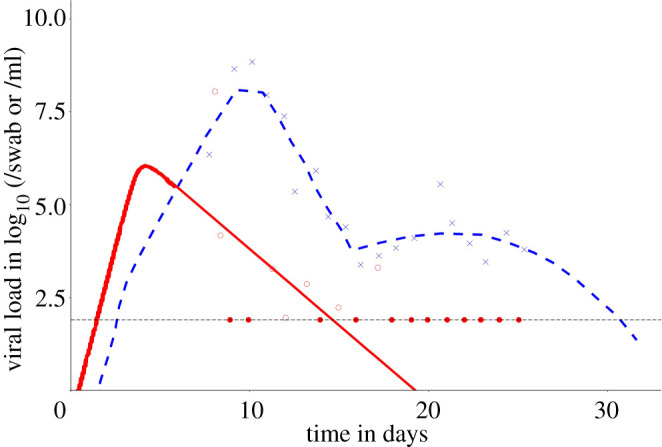
Data from Ke et al. [52] describing viraemia in hospitalized patients over time since infection, employing data from Germany in the early stages of the pandemic [42]. The red dots are viral load in the URT and the blue crosses are viral load in the LRT. The dotted horizontal line is the limit of detection. The red and blue lines are fits of the model of viral dynamics within patients. The model assumes target cell limitation and spatial spread of virions within the host. The model was fitted to data points by minimizing the residual sum of squares. For details see Ke et al. [52]. The filled dots represent values at the limit of detection.