
Figure 1.
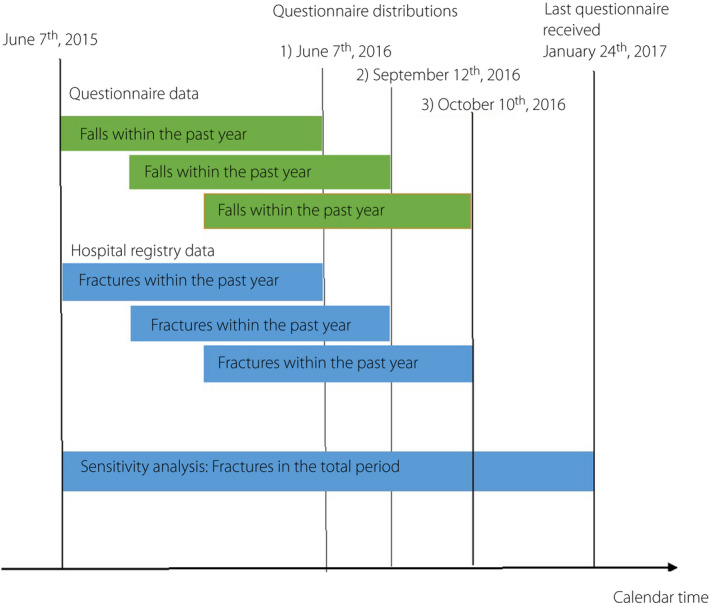
Dates for the questionnaire distributions and the corresponding time period used for the assessment of falls and fractures. Orange boxes represent time periods over which falls were assessed in the questionnaire. Blue boxes show the corresponding periods used for data extraction from the registry and represent time period over which fractures were obtained. The sensitivity analysis included the entire time period until 24 January 2017.