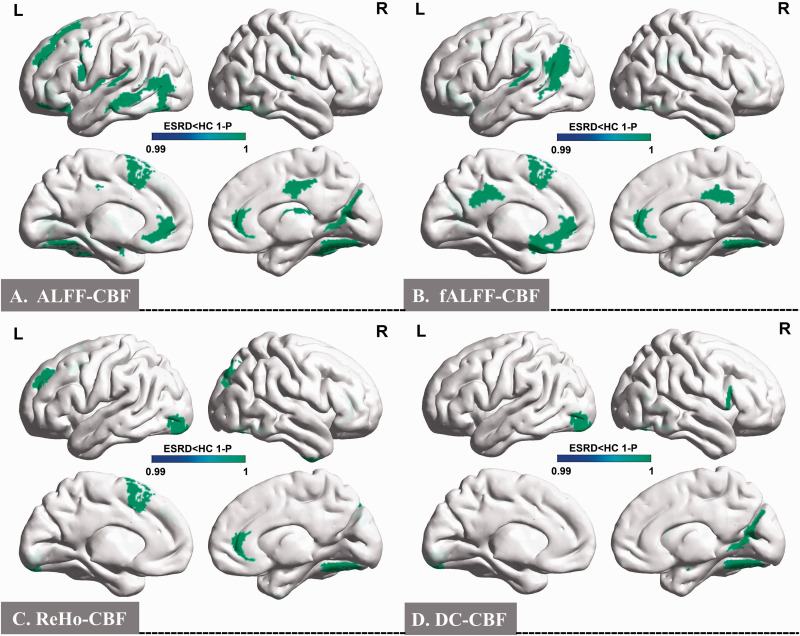
Figure 1.
Spatial distribution maps between-group differences of the four types of NVC patterns. In comparison with HCs, ESRD patients showed significantly lower ALFF-CBF, fALFF-CBF, ReHo-CBF, and DC-CBF coefficients in 34 brain regions at the Human Brainnetome Atlas (p < 0.01, FDR correction).
NVC: neurovascular coupling; ALFF: amplitude of low-frequency fluctuation; fALFF: fractional ALFF; ReHo: regional homogeneity; DC: degree centrality; HCs: healthy control subjects; ESRD: end-stage renal disease; FDR: false discovery rate.

