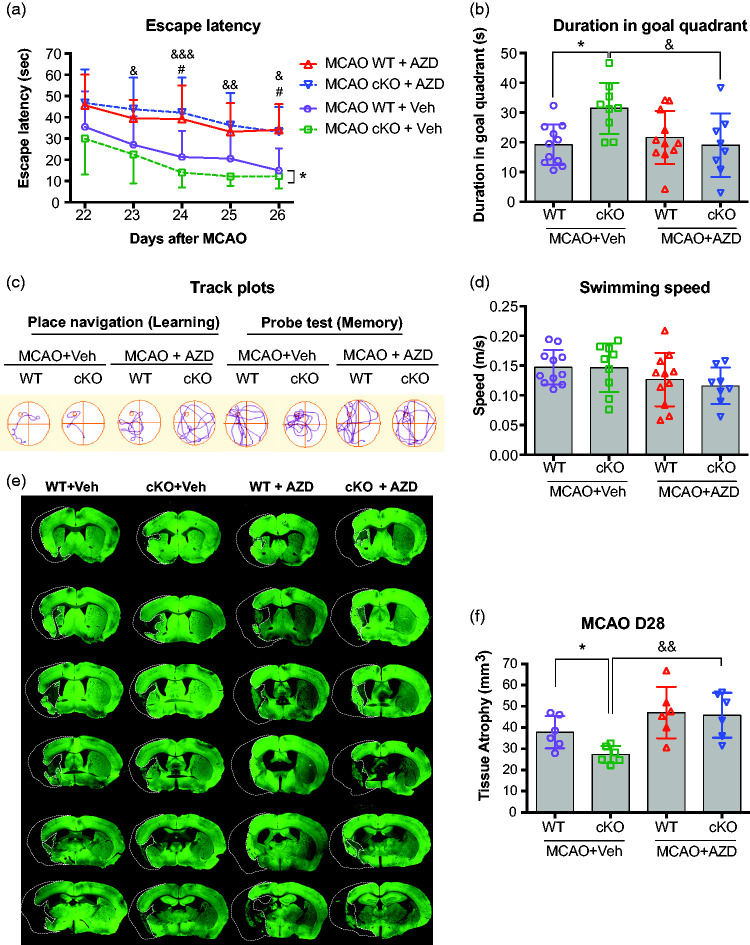
Figure 2.
AZD0530 treatment impairs cognitive function and exacerbates brain atrophy in EC-targeted miR-15a/16-1 cKO mice after cerebral ischemia. EC-miR-15a/16-1 cKO mice and WT littermate controls were subjected to 1 h MCAO followed by 28d of reperfusion. Vehicle (Veh) or AZD0530 (AZD, 20 mg/kg) was administered daily to both genotypes 3-21d after MCAO by oral gavage. (a–d) Long-term cognitive functions were assessed by the Morris water maze. The time spent for the animals to locate the submerged platform (escape latency) was measured at 22-26 d after MCAO (a). Spatial memory was evaluated at 27 d after MCAO by measuring the time spent in the goal quadrant after the platform was removed (b). Representative swimming paths tracked for different experimental groups (c). Gross locomotor function was measured by average swimming speed (d), which was not affected by endothelium-targeted deletion of the miR-15a/16-1 cluster or by the treatment of AZD0530. Data are expressed as the mean ± SD. n = 11 for MCAO WT + Veh group, n = 9 for MCAO cKO + Veh group, n = 11 for MCAO WT + AZD group and n = 8 for MCAO cKO + AZD group. *p < 0.05 between MCAO WT + Veh and MCAO cKO + Veh groups; #p < 0.05 between MCAO WT + Veh and MCAO WT + AZD groups; &p < 0.05, &&p < 0.01, &&&p < 0.001 between MCAO cKO + Veh and MCAO cKO + AZD groups. (e,f) Brain atrophy was measured and quantified by microtubule-associated protein 2 (MAP2) immunostaining. Dashed lines outline the region of brain atrophy. Representative MAP2 immunofluorescent images (e), and quantitative analysis (f) showed that endothelium-targeted miR-15a/16-1 deletion reduced brain atrophy compared to WT mice, whereas AZD0530 treatment exacerbated brain atrophy in EC-miR-15a/16-1 cKO mice at 28 d after MCAO. No significant difference was found between WT + Veh and WT + AZD groups. Data are expressed as the mean ± SD. n = 6 for each group. *p < 0.05 between MCAO WT + Veh and MCAO cKO + Veh groups; &&p < 0.01 between MCAO cKO + Veh and MCAO cKO + AZD groups. Statistical analysis was performed by one-way (Figure 2(b), (d), and (f)), or two-way ANOVA (Figure 2(a)) and followed by Bonferroni's multiple comparison tests.

