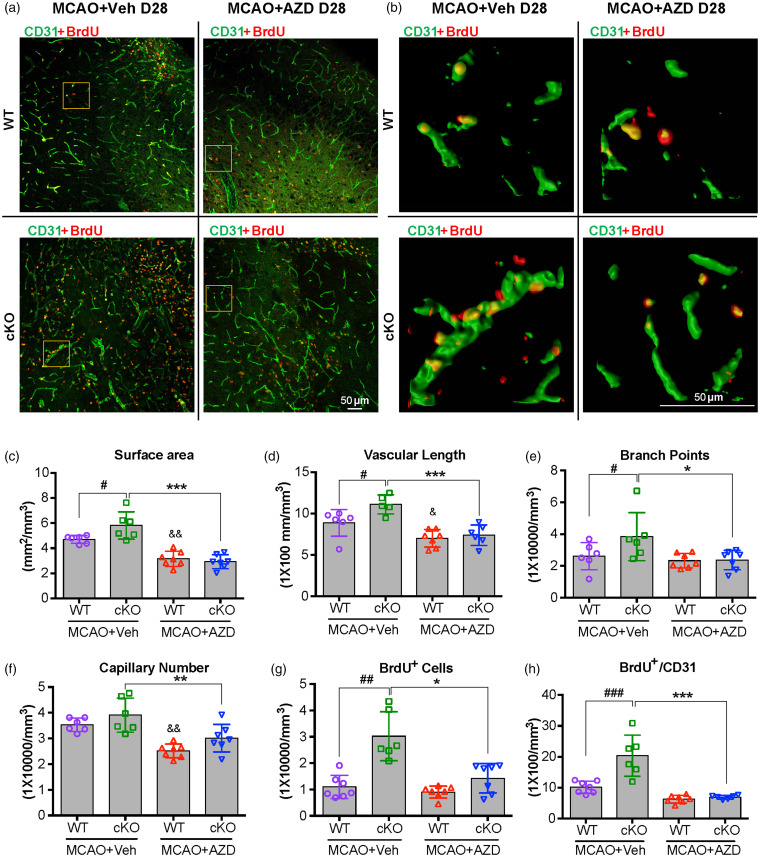
Figure 4.
AZD0530 treatment inhibits the generation of newly formed microvessels in the penumbral regions of EC-targeted miR-15a/16-1 cKO mice after cerebral ischemia. EC-miR-15a/16-1 cKO mice and WT littermate controls were subjected to 1 h MCAO followed by 28d reperfusion. Vehicle (Veh) or AZD0530 (AZD, 20 mg/kg) was administered daily to both genotypes at 3-21d after MCAO by oral gavage. CD31 (green) and BrdU (red) double-immunostaining was utilized to determine the newly formed microvessels in the penumbral regions of the brains. The BrdU+/CD31+ dual-labeled signals exhibited yellow color. Yellow boxes indicated areas in (a) that were enlarged and 3D reconstructed in (b). (a–f) Representative images (a), representative 3D reconstructed images (b), quantitative analysis of surface area (c), vascular length (d), branch points (e), and capillary number (f) of CD31 immunofluorescent signal showed enhanced angiogenesis in penumbral regions of EC-miR-15a/16-1 cKO mice compared to WT controls 28 d reperfusion after MCAO, whereas AZD0530 treatment significantly downregulated the enhanced-angiogenesis in EC-miR-15a/16-1 cKO mice after cerebral ischemia. (a,b,g,h) Representative CD31 and BrdU immunofluorescent images (a), representative 3D reconstructed images (b), quantification of the BrdU+ cells (g), and BrdU+/CD31+ signals (h) in the brain penumbral regions demonstrated increased newly generated cells and newly formed microvessels (angiogenesis) in the EC-miR-15a/16-1 cKO mice compared to WT controls, while AZD0530 treatment robustly inhibited angiogenesis in the EC-miR-15a/16-1 cKO mice after cerebral ischemia. Scale bar, 50 μm. Data are expressed as the mean ± SD. n = 6-7 for each group. &p < 0.05, &&p < 0.01 between MCAO WT + Veh and MCAO WT + AZD groups; *p < 0.05, **p < 0.01, ***p < 0.001 between MCAO cKO +Veh and MCAO cKO + AZD groups. #p < 0.05, ##p < 0.01, and ###p < 0.001 as indicated. Statistical analysis was performed by one-way ANOVA followed by Bonferroni's multiple comparison tests (Figure 4(c) to (f) and (h)) or Kruskal–Wallis test followed by Dunn's multiple comparison tests (Figure 4(g)).

