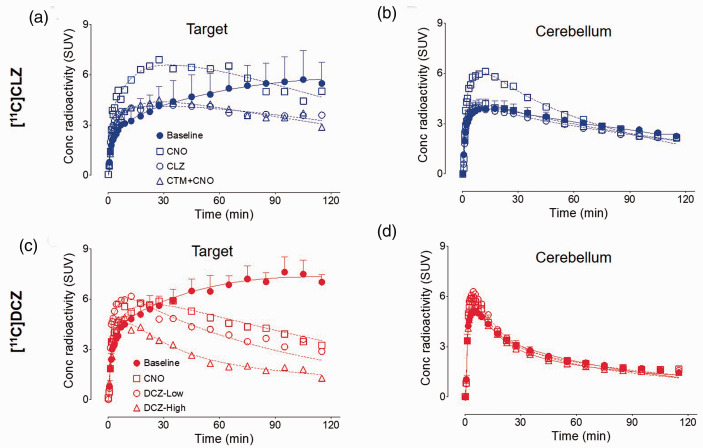
Figure 2.
Time-activity curves of the target region and cerebellum for [11C]clozapine ([11C]CLZ) (a and b) and [11C]deschloroclozapine ([11C]DCZ) (c and d). For the baseline scans (three for each radioligand), the solid symbols represent mean ± SD. The doses of the blocking agents are provided in the legend of Figure 1.

