. 2021 Sep 15;10:e69883. doi: 10.7554/eLife.69883

Figure 3. Mvp1 recognizes Vps55 through a specific sorting motif.

(A, B, and D) Schematic of Vps55 mutational analysis and quantitation of Vps55-GFP mutant localization, from Figure 3—figure supplement 1A (A), Figure 3—figure supplement 1B (B), and Figure 3—figure supplement 1C (D). (C) The localization of Vps55-GFP mutants. (E) The Mvp1-Vps55 interaction in Vps55-FLAG mutants. Vps55-FLAG mutants were immunoprecipitated (IP) from cells expressing Mvp1-GFP, and the IP products were analyzed by immunoblotting using antibodies against FLAG, green fluorescent protein (GFP), and glucose-6-phosphate dehydrogenase (G6PDH). (F) Schematic of Vps55 and the residues facilitating its interaction with Mvp1. (G) The localization of overexpressed Vps55-GFP. (H) Vps55-GFP sorting in vacuolar hydrolases (pep4Δ and pep4Δ prb1Δ) and ESCRT (vps4Δ) mutants. Cell lysates expressing Vps55-GFP were analyzed by immunoblotting using antibodies against GFP and G6PDH. (I) The ubiquitination of overexpressed Vps55-GFP. Overexpressed Vps55-GFP was immunoprecipitated from yeast cells under denaturing conditions, and the IP products were analyzed by immunoblotting using antibodies against GFP and ubiquitin. (J) Vps55-GFP-Ub localization in ESCRT mutants. (K) Model of Vps55 recycling and degradation at the endosome. For all quantification shown in this figure, n = >30 cells from three independent experiments. Scale bar: 1 µm.

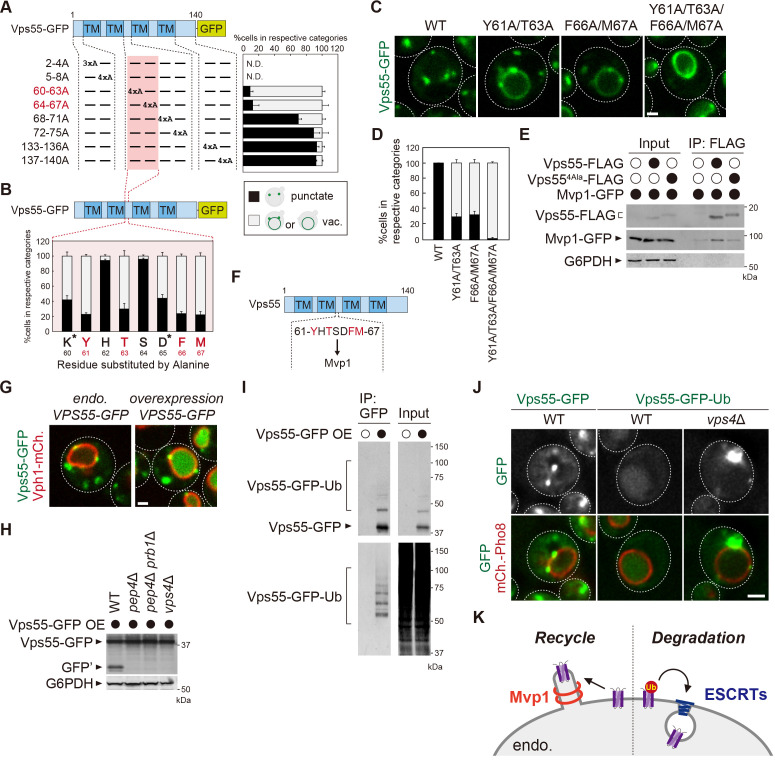
Figure 3—source data 1. Source data associated with Figure 3A.
Figure 3—source data 2. Source data associated with Figure 3B.
Figure 3—source data 3. Source data associated with Figure 3D.
Figure 3—source data 4. Uncropped gel images of Figure 3E.
Figure 3—source data 5. Uncropped gel images of Figure 3H.
Figure 3—source data 6. Uncropped gel images of Figure 3I.

Figure 3.

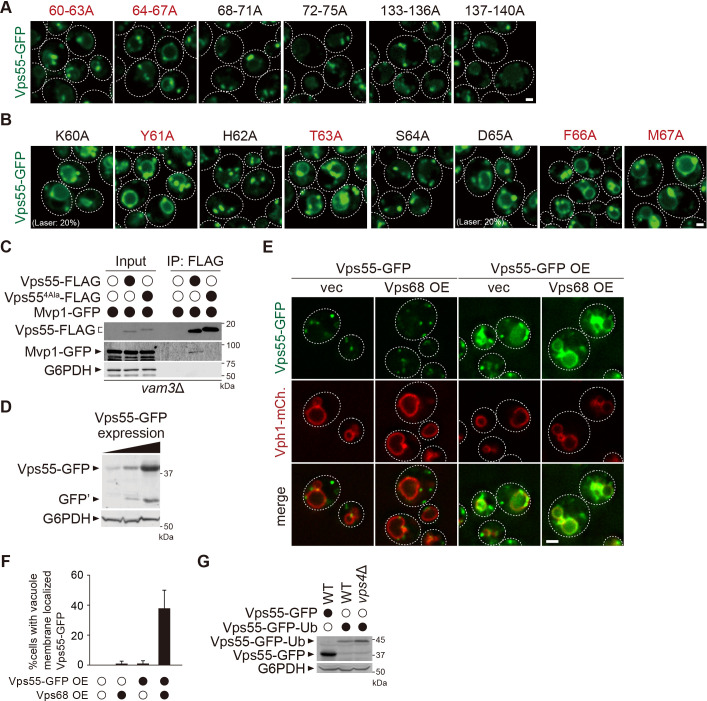
Figure 3—figure supplement 1. The analysis of Vps55.

Figure 3—figure supplement 1.

(A and B) Localization of Vps55-GFP mutants. In K60A and D65A mutants, the excitation laser intensity was lowered to 20%, because its expression was higher than other mutants. (C) The Mvp1-Vps55 interaction in vam3Δ cells. Vps55-FLAG mutants were immunoprecipitated (IP) from vam3Δ cells expressing Mvp1-GFP, and the IP products were analyzed by immunoblotting using antibodies against FLAG, green fluorescent protein (GFP), and glucose-6-phosphate dehydrogenase (G6PDH). (D) Immunoblotting of cells expressing increasing amounts of Vps55-GFP. (E) The localization of overexpressed Vps55-GFP and Vps68. (F) Quantification of Vps55-GFP localization from three independent experiments. N = >30 cells. (G) Cell lysates expressing Vps55-GFP or Vps55-GFP-Ub were analyzed by immunoblotting using antibodies against GFP and G6PDH. Scale bar: 1 µm.
Figure 3—figure supplement 1—source data 1. Uncropped gel images of Figure 3—figure supplement 1C.
Figure 3—figure supplement 1—source data 2. Uncropped gel images of Figure 3—figure supplement 1D.
Figure 3—figure supplement 1—source data 3. Source data associated with Figure 3—figure supplement 1F.
Figure 3—figure supplement 1—source data 4. Uncropped gel images of Figure 3—figure supplement 1G.