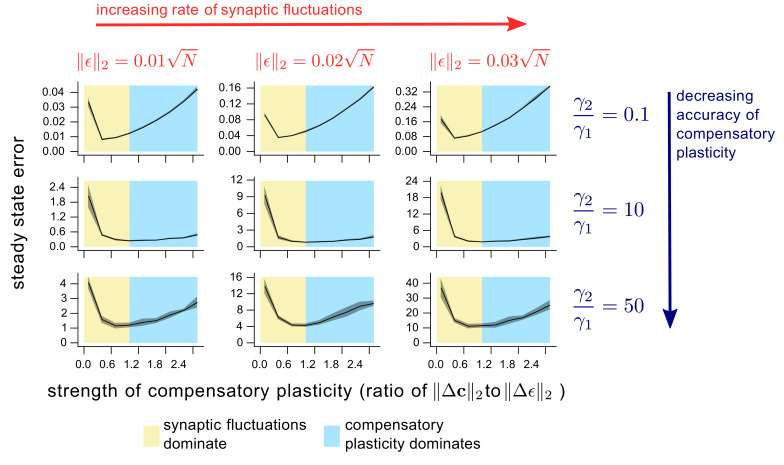
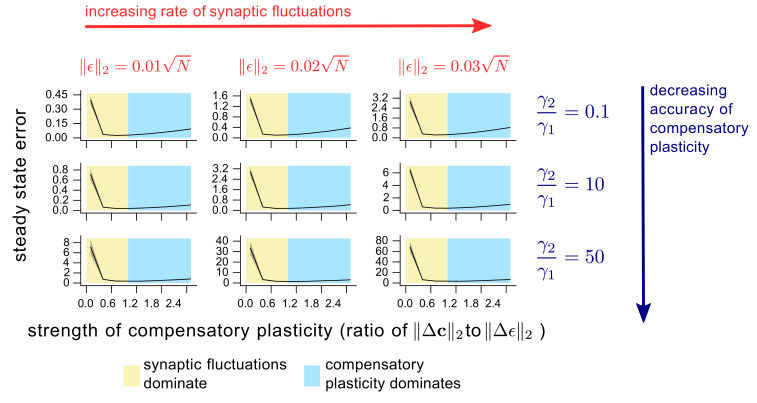
Figure 5. The dependence of steady state task performance in a nonlinear network on the magnitudes of compensatory plasticity and synaptic fluctuations, and on the learning rule quality.
Each value on a given graph corresponds to an 8000 timepoint nonlinear neural network simulation (see ‘Methods’ for details). The value gives the steady-state task error (average task error of the last 500 timepoints) of the simulation, while the value gives the ratio of the magnitudes of the compensatory plasticity and synaptic fluctuations terms. Steady state error is averaged across 8 simulation repeats; shading depicts one standard deviation. Between graphs, we change simulation parameters. Down rows, we increase the proportionate noise corruption of the compensatory plasticity term (see Materials and methods section for details). Across columns, we increase the magnitude of synaptic fluctuations.


