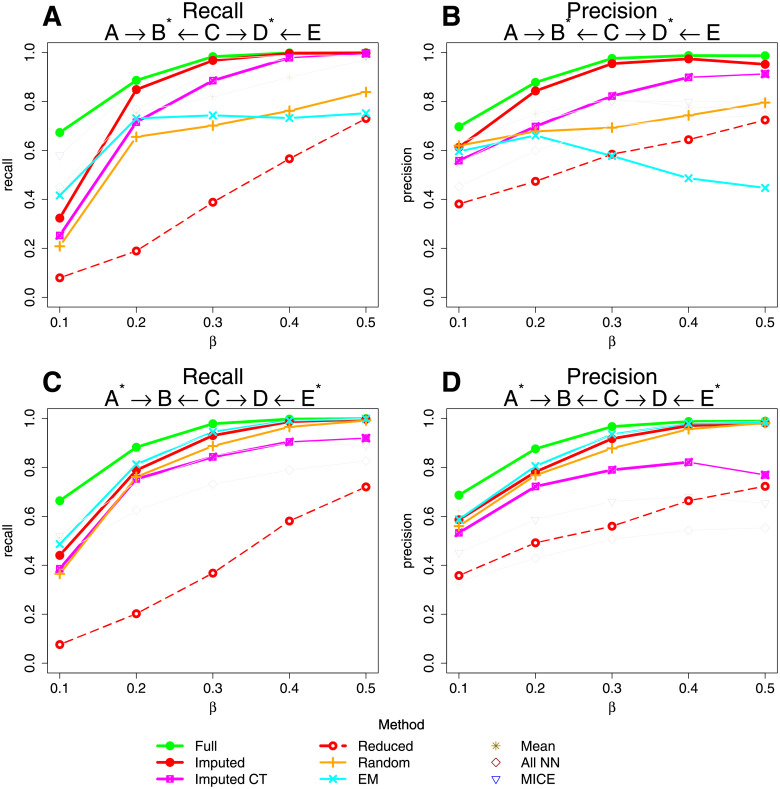
Fig 2. Line graphs showing the recall and precision of the best fit network found by BayesNetty (and alternative approaches) when the simulation network was A → B ← C → D ← E for different data sets.
The asterisks denote which variables had missing values for 1800 individuals from a total of 2000 individuals. The parameter β denotes the model strength that was used to simulate the data. Full: the data consisted of the original simulation data with no missing values. Imputed: the data was imputed using our default algorithm. Reduced: the data was reduced to the 200 individuals with no missing values. Imputed CT: the data was imputed with complete data training. EM: the data was imputed with an expectation-maximisation algorithm in R. Random: missing data was replaced by random values drawn from the same variable. Mean: missing data was replaced by the mean value of the same variable. All NN: the data was imputed using our default algorithm but with all variables used to inform the choice of nearest neighbour. MICE: the data was imputed using the multivariate imputation by chained equations approach.

