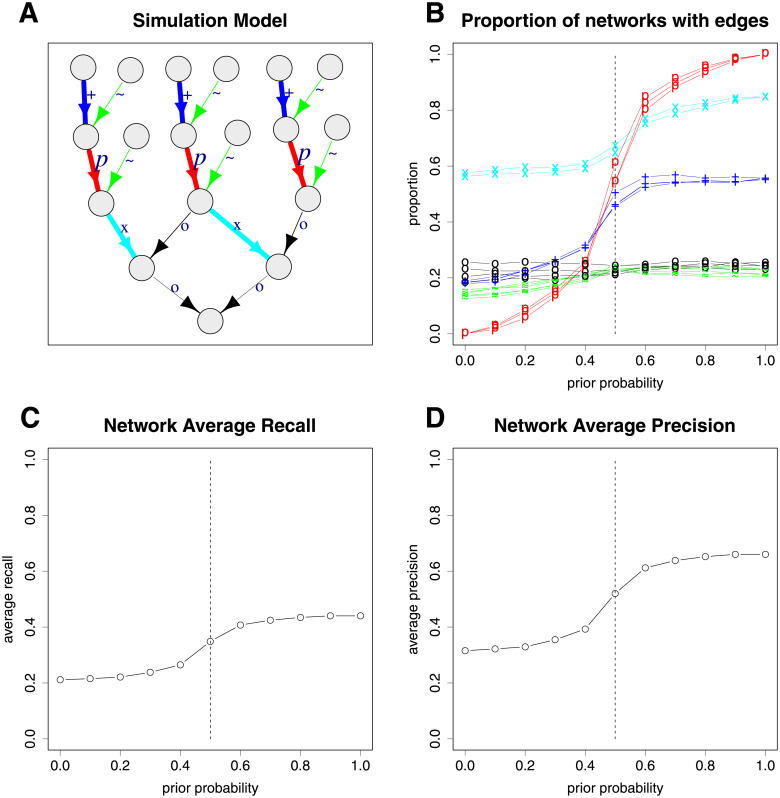
Fig 5. Plots showing the results of 10,000 network simulations: (A) the simulation network; (B) the proportion of times each simulation edge appears in the best fit networks; (C) the average network recall; (D) the average network precision.
The effects of changing the prior probabilities of the red edges (labelled with p) in the plotted direction are shown in plots (B)-(D). The dashed vertical lines show when the prior probabilities are 0.5, that is, no preference in either direction. The green edges (labelled with ∼) are constrained to be in the shown direction. The colours and labels in plot (A) correspond to those in plot (B).

