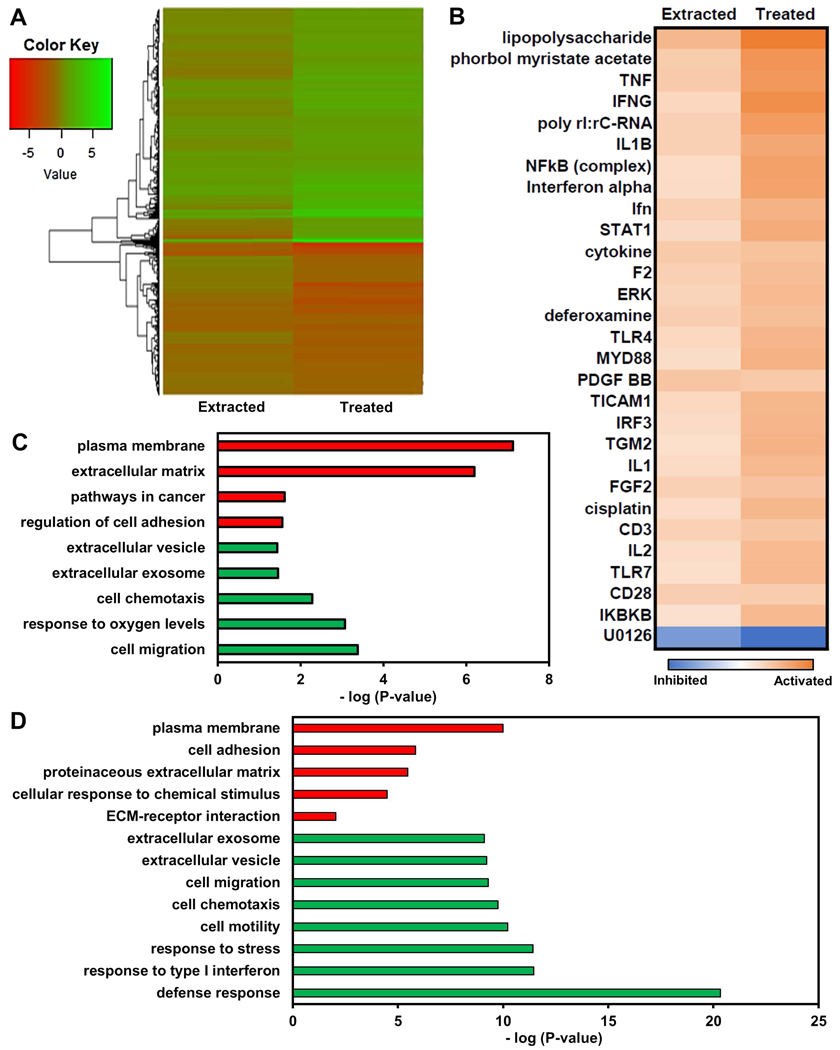
Figure 4. OVCAR-3 cells selected by immobilization regulate genes similarly to cells surviving cisplatin treatment.
(A) Heatmap of log2FC of gene expression in cells immobilized for three days, extracted, and cultured in standard 2-D conditions for two weeks (“Extracted”) and cells surviving treatment with 0.5 μM cisplatin for 24 hours and allowed to recover for 2 weeks in standard 2-D culture conditions (“Treated”) relative to control cells. (B) List of top 30 common upstream regulators (determined by average Z-score with P < 0.05) in “Extracted” and “Treated” cells based upon differentially expressed genes relative to control cells using Ingenuity Pathway Analysis. (C,D) Gene ontology enrichment analysis using genes significantly upregulated (green) or downregulated (red) in “Extracted” (C) or “Treated” (D) samples relative to 2-D controls.

