Figure 6.

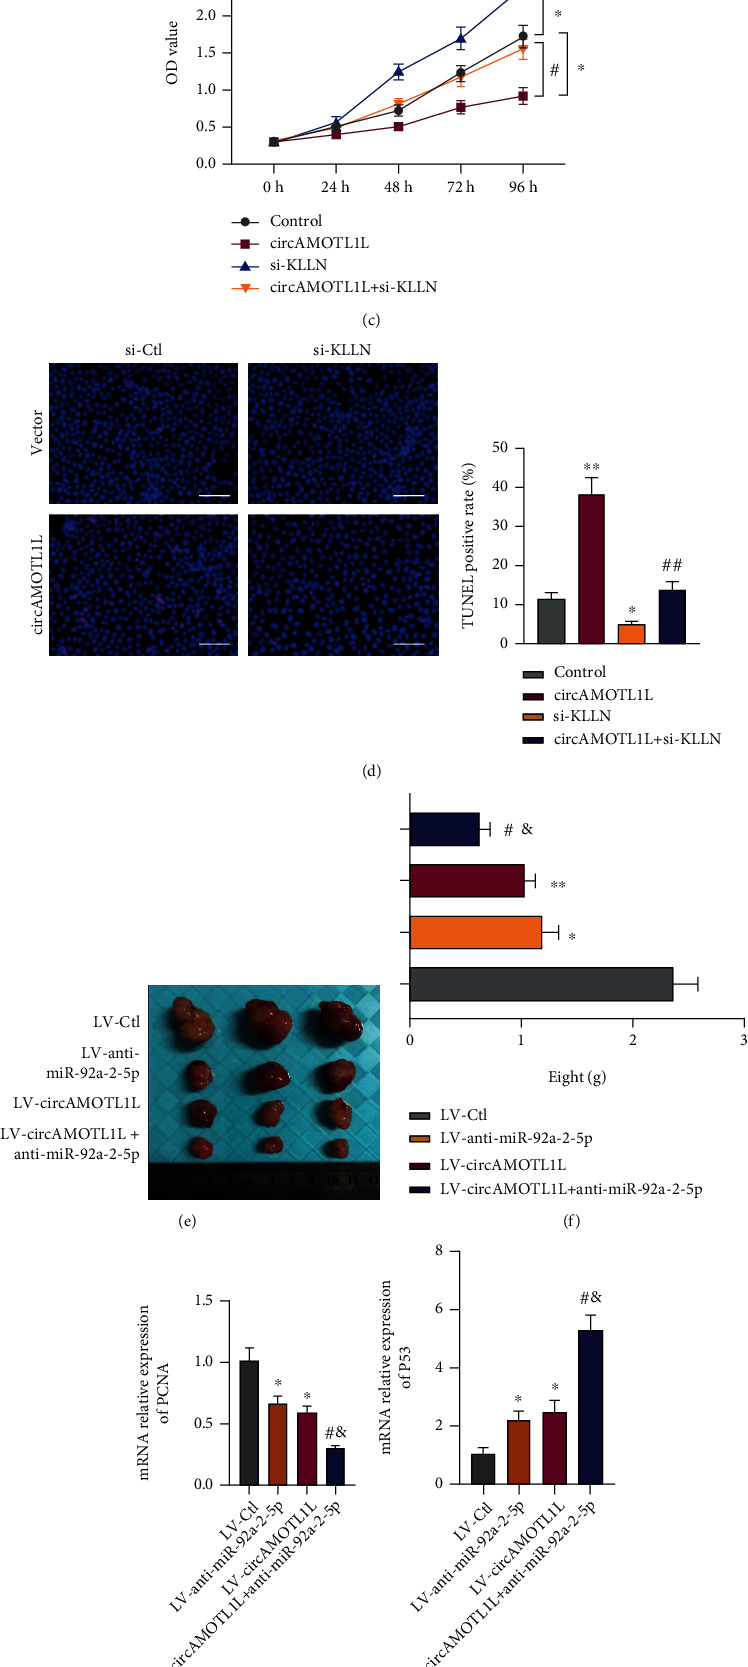
The circAMOTL1L–miR-92a-2-5p–KLLN axis is involved in the growth of RCC. (a, b) Western blotting detected KLLN protein levels in 786-O cells after transfection with pcDNA-circAMOTL1L, miR-92a-2-5p mimic, and anti-miR-92a-2-5p or cotransfection with pcDNA-circAMOTL1L and miR-92a-2-5p mimic or anti-miR-92a-2-5p. ∗∗p < 0.01 vs. control group; ##p < 0.01 vs. pcDNA-circAMOTL1L group. (c) CCK-8 assay examined cell proliferation in 786-O cells after transfection with pcDNA-circAMOTL1L or si-KLLN or cotransfection with both. ∗p < 0.05 vs. control group; #p < 0.05 vs. pcDNA-circAMOTL1L group. (d) TUNEL assay detected apoptosis in 786-O cells treated as (c). ∗p < 0.05, ∗∗p < 0.01 vs. control group; ##p < 0.01 vs. pcDNA-circAMOTL1L group (scale bars = 50 μm). The above graph bars represent mean ± SEM of three independent experiments. (e, f) Representative dissected xenograft tumors from nude mice subcutaneously injected with 786-O cells engineered to stably overexpress circAMOTL1L (LV-circAMOTL1L), anti-miR-92a-2-5p (LV-anti-miR-92a-2-5p), or both for 3 weeks (LV-Ctl as the negative control) and corresponding weight measurement. ∗p < 0.05, ∗∗p < 0.01 vs. LV-Ctl; #p < 0.05 vs. LV-circAMOTL1L; &p < 0.05 vs. LV-anti-miR-92a-2-5p. (g, h) qRT-PCR examined PCNA and P53 expression in xenograft tumors. ∗p < 0.05 vs. LV-Ctl; #p < 0.05 vs. LV-circAMOTL1L; &p < 0.05 vs. LV-anti-miR-92a-2-5p (n = 6 in each group). (i) Western blotting detected KLLN protein levels in xenograft tumors from the LV-circAMOTL1L plus LV-anti-miR-193a-5p infection group and LV-Ctl group. ∗p < 0.05 vs. LV-Ctl.
