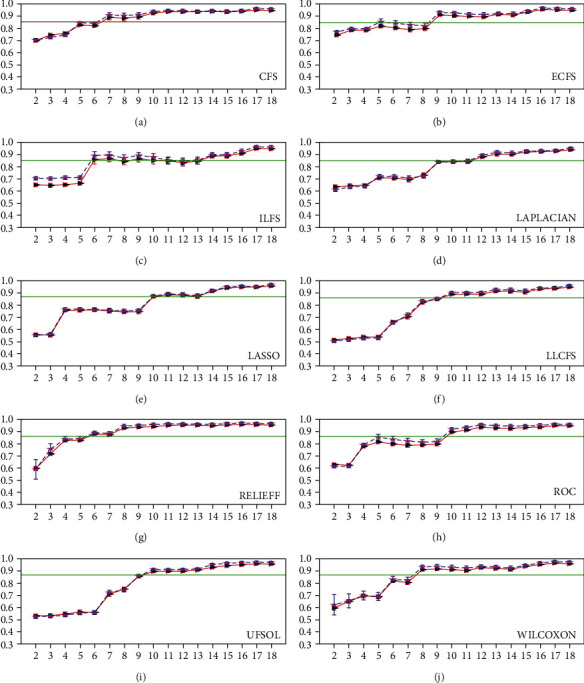
Figure 2.

AUC. A baseline (green) of AUC equal to 0.85 is added to the plots. In each plot, the red solid line indicates the test result, while the blue dashed line shows the retest result. Besides, error bars are added. Please note that the figure can be enlarged to perceive details.
