
Figure 3.
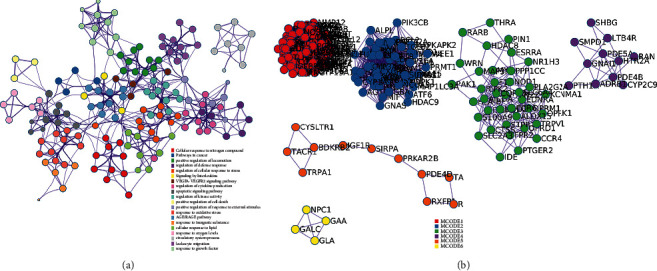
Visualizations of functional enrichment and interactome analysis result. (a) PPI network colored by cluster; (b) clusters.
Official websites use .gov
A
.gov website belongs to an official
government organization in the United States.
Secure .gov websites use HTTPS
A lock (
) or https:// means you've safely
connected to the .gov website. Share sensitive
information only on official, secure websites.
Visualizations of functional enrichment and interactome analysis result. (a) PPI network colored by cluster; (b) clusters.