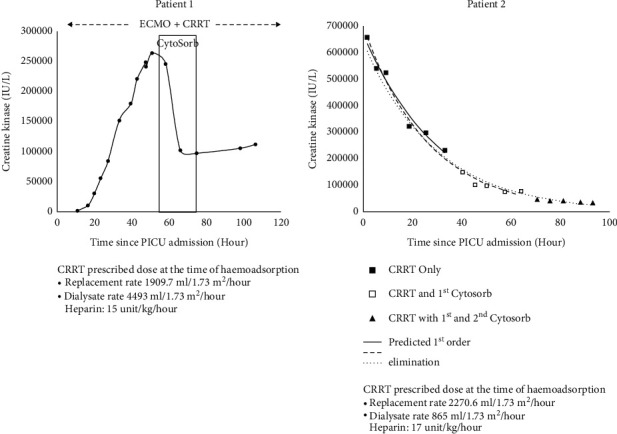
Figure 1.

Trend of creatine kinase levels during CRRT and haemoadsorption treatment. For patient 2, the serum creatine kinase level after admission was plotted against time. A trend line using log scale was created for three different sets of data for first-order elimination prediction (black square represents data from CRRT only, white square represents data from CRRT plus 1st column of CytoSorb, and black triangle represents data from CRRT plus 1st and 2nd columns of CytoSorb). A slightly faster rate of decline could be observed from data using both CRRT and CytoSorb.
