Figure 4.

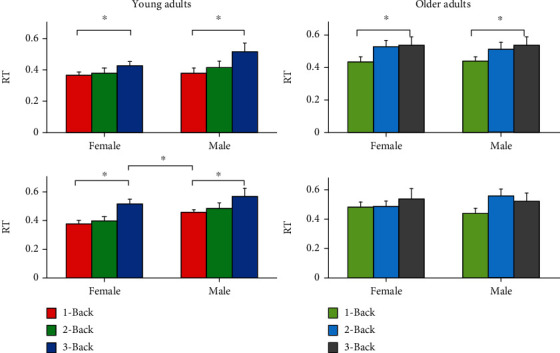
Means ± SD for reaction time (RT) for young (a) and older (b) adults comparing females and males during N-Back task performance for the three different N-Back levels.

Means ± SD for reaction time (RT) for young (a) and older (b) adults comparing females and males during N-Back task performance for the three different N-Back levels.