
Figure 5.
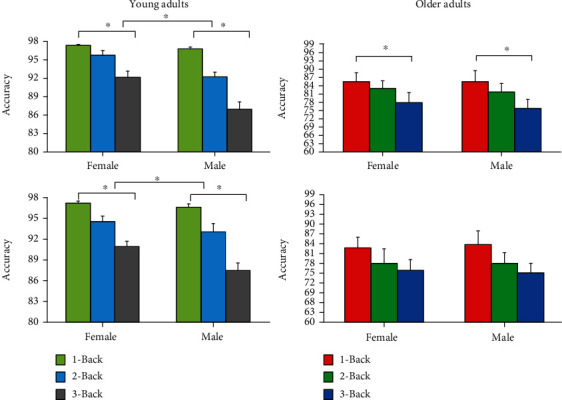
Means ± SD for accuracy for young (a) and older (b) adults comparing females and males during N-Back task performance for the three N-Back levels.
Official websites use .gov
A
.gov website belongs to an official
government organization in the United States.
Secure .gov websites use HTTPS
A lock (
) or https:// means you've safely
connected to the .gov website. Share sensitive
information only on official, secure websites.
Means ± SD for accuracy for young (a) and older (b) adults comparing females and males during N-Back task performance for the three N-Back levels.