
Figure 8.
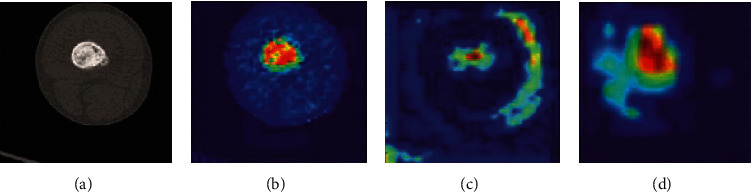
The presentation of raw data and heatmap. (a) A typical input image. (b) The heatmap generated by conv1. (c) The heatmap produced by conv2. (d) The heatmap generated as the output of conv3. It is determined by the images that the more we go deeper into the network, the more the abstract and semantic meanings contained in the heatmap [71].