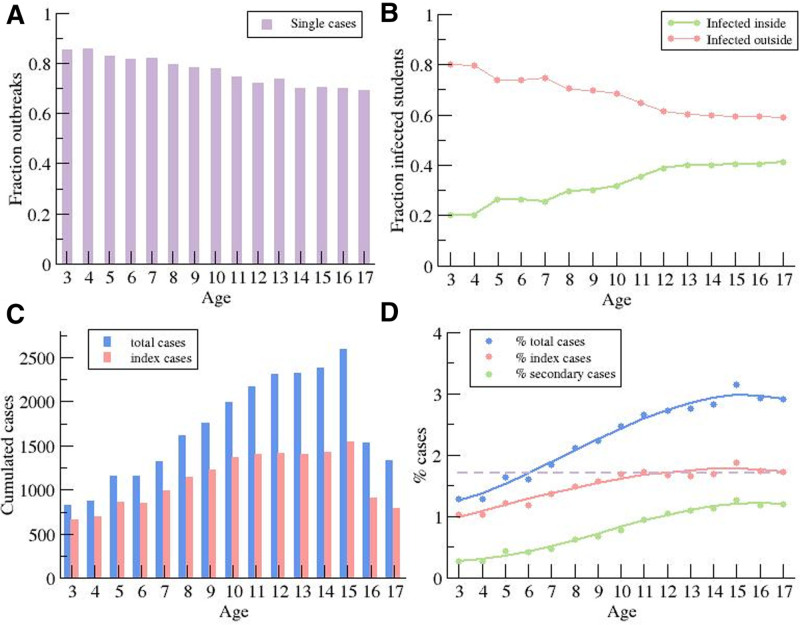
FIGURE 3.
Distribution of daily new cases by age. A: Dependence of the fraction of index cases without secondary cases on the educational level. B: Fraction of students infected inside and outside of the bubble group, assuming no simultaneous infections by different index cases. C: Total number of cases and index cases for different educational level. D: Percentage of students infected during the 3 months (as reference for Catalonia 3% of the population were infected), percentage of case indexes, and percentage of secondary cases.

