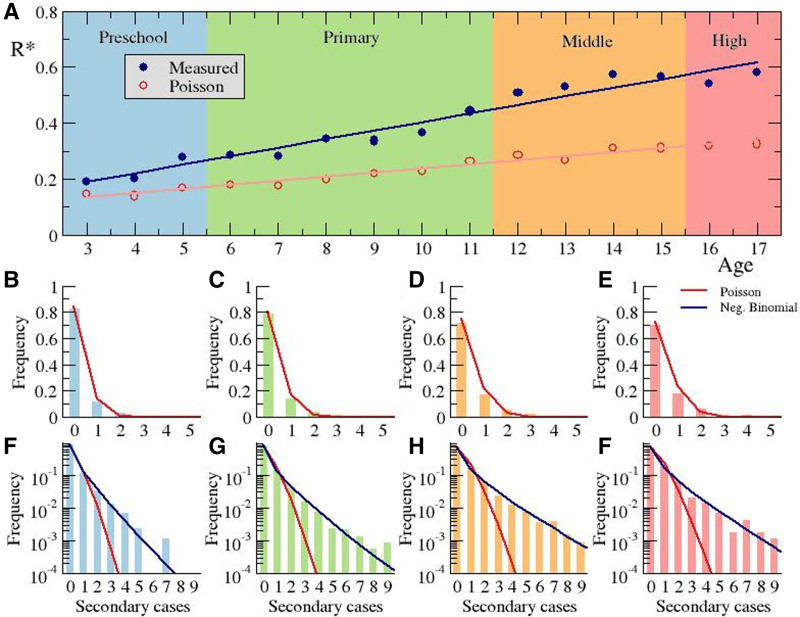
FIGURE 4.
Calculation of the reproductive number. A: Dependence of the reproductive number on the educational level and the corresponding associated age. Frequency of the number of secondary cases per index case for preschool (B, F) primary (C, G), middle (D, H), and high (E, I) school, using linear (B–E) and logarithmic (F–I) scales. Poisson distribution is fitted employing a least square method for red lines in panels (B–I), and the negative binomial distribution is fitted employing maximum likelihood estimation method10 for blue lines in panels (F–I) giving rise to values R = 0.27 and dispersion parameter k = 0.41 (F), R = 0.35 and dispersion parameter k = 0.32 (G), R = 0.55 and dispersion parameter k = 0.35 (H), R = 0.56 and dispersion parameter k = 0.41 (I).

