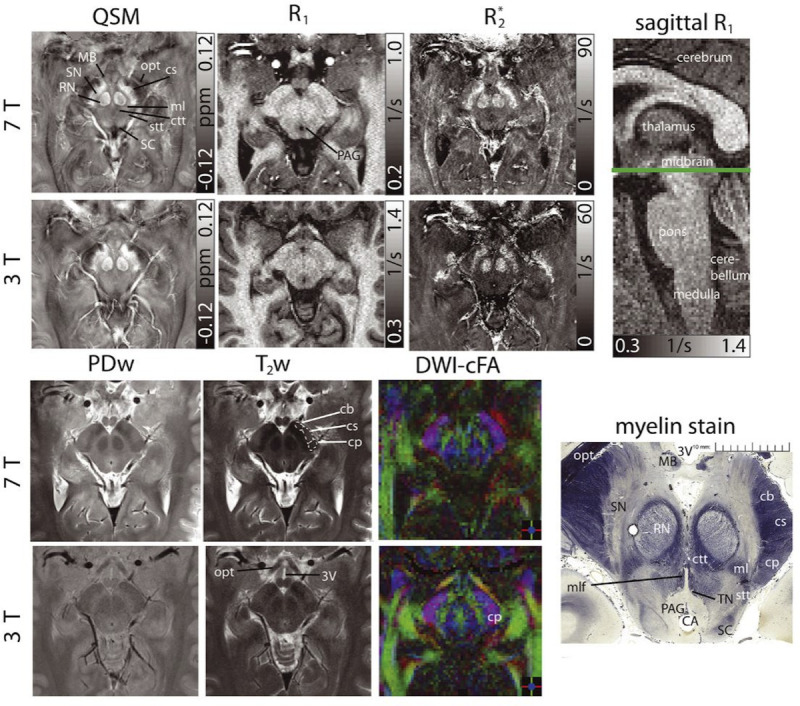
FIGURE 2.

Susceptibility, R1, R2* maps, proton density-, T2-weighted images, and color-coded diffusion anisotropy maps (left to right and top to bottom) of the same transverse slice in one healthy volunteer showing detailed anatomical substructures in the midbrain at 7 T and 3 T. A sagittal R1 image indicates the slice location. Histologic myelin stain additionally shown for anatomical correlation (myelin stain reproduced from http://www.brains.rad.msu.edu and http://brainmuseum.org, supported by the US National Science Foundation). The cerebral aqueduct (CA), crus cerebri (corticobulbar fibers [cb], corticospinal fibers [cs], corticopontine fibers [cp]), the central tegmental tract (ctt), the mammillary body (MB), the medial lemniscus (ml), the medial longitudinal fasciculus (mlf), the optic tract (opt), the periaqueductal gray (PAG), the red nuclei (RN), the spinothalamic tract (stt), the substantia nigra (SN), the superiorcolliculus (SC), and the third ventricle (3 V) are indicated. The trochlear nuclei (TN) can only be clearly delineated in the histology stain. For better clarity, bilateral structures are only indicated monolaterally and at 7 T images. Reused with permission from John Wiley & Sons, Straub et al.49
