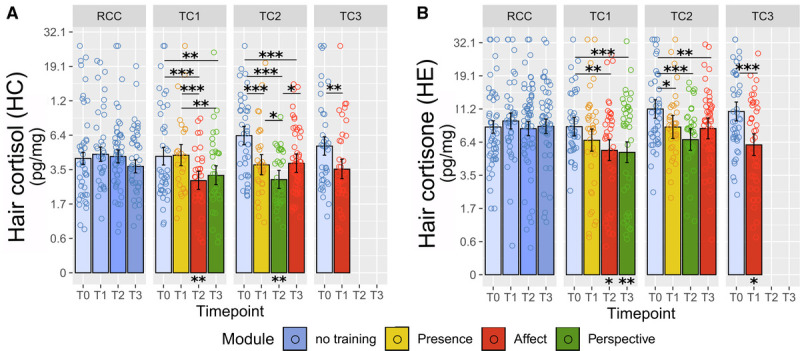
FIGURE 3.

Training effects on HC and HE. Estimated HC (A) and HE (B) levels were derived from the linear mixed-model analysis as a function of training cohort and time point. Note the natural log scale on the y-axis. Error bars represent ±1 SE; each circle represents one raw data point with outliers winsorized as described in the Methods section. Asterisks below bars indicate comparison with the RCC at the matched time point. *Significant at p ≤ .05. **Significant at p ≤ .01. ***Significant at p ≤ .001. See Tables S5 and S6, http://links.lww.com/PSYMED/A759 for a full list of contrast outcomes. HC = hair cortisol; HE, hair cortisone; SE, standard error; RCC, retest control cohort; TC, training cohort. Color image is available online only at www.psychosomaticmedicine.org.
